E2M RESEARCH · QUARTERLY FLAGSHIP · Q3 2026
Quarterly Brazil Expansion Report — Q3 2026
A quarterly executive synthesis of the evidence that can change a Brazil expansion decision: business environment, entry timing, costs, hiring, office, housing and commercial launch.
Published 25 September 2026 using the latest defensible observation available for each indicator. This report is web-only, source-led and designed to be updated without converting E2M scenarios into market facts.
Executive read
Brazil remains investable—but sequencing matters more than speed.
Growth is positive but slower, inflation has cooled, monetary policy is easing from a still-restrictive level, formal employment remains high, and tax reform is now an operating-systems issue rather than a distant legal topic. For a foreign entrant, the practical implication is disciplined staged commitment: prove demand, choose the operating model, then add fixed cost.
Quarterly decision rules
- Validate commercial demand before adding avoidable fixed cost.
- Use EOR or other low-commitment structures when the first-hire need precedes entity economics.
- Select office and housing from customer/talent geography, not prestige alone.
- Treat CBS/IBS transition as a finance-systems workstream in 2026.
- Measure GTM quality by qualified conversations and pipeline evidence before judging a new market only by closed revenue.
Evidence boundary
This report is decision support, not legal, tax, investment or employment advice. It mixes official facts, independent benchmarks and explicitly labeled E2M planning scenarios; they should not be cited as if they were the same evidence class.
Business environment
Five signals frame the quarter.
These are the latest official observations available at the 25 September cutoff; periods differ because the underlying publications have different calendars.
Q2 2026A · official
Aug 2026A · official
Effective 17 Sep 2026A · official
Jul 2026A · official
2026A · official
Market entry
Validation can start immediately; permanent structure should follow the operating need.
E2M’s timing framework separates commercial validation from hiring, entity formation, importing and regulated operations. The ranges below are planning references—not guarantees.
| Operating path | Best-case start | Typical planning range |
|---|---|---|
| Market validation / BD only | Day 1 | 1–7 days |
| EOR / first employee | 7–14 days | 15–30 days |
| Brazilian Ltda with foreign shareholder | 7–15 business days after documents are ready | 20–45 calendar days to an operational baseline |
| Importer / non-regulated commercial operation | 30–45 days | 45–90 days |
| Regulated product / licensed operation | 60–90 days | 90–180+ days |
Do not let legal structure or infrastructure run materially ahead of demand evidence unless regulation, invoicing, hiring or import requirements force the sequence. Full timeline benchmark →
Entry economics
Fixed-cost commitment changes the economics quickly.
Three planning architectures show how headcount, workspace, housing and commercial launch can compound. These are scenarios, not market averages.
| Scenario | Headcount | First 90 days | First 12 months |
|---|---|---|---|
| Lean validation | 1 | R$119.4k | R$254k |
| Base local team | 3 | R$267.6k | R$830.4k |
| Full operating presence | 12 | R$744.8k | R$2.79m |
Governance note: headline USD conversions are intentionally omitted because the Content Refresh System flags the current PTAX snapshot as overdue at the report cutoff. BRL source values remain the primary planning reference. Full cost methodology →
Hiring
Salary is only the first layer of Brazil team economics.
The most useful planning view combines role-level starting salaries with employer-cost architecture and then adds benefits, variable compensation and employee-specific facts.
R$53.5k/mo
4-person sales-validation team · monthly gross base
E2M Salary Benchmark 2026 · P50-based illustrative team.
R$17k
Sales & Marketing family · median of role-level P50s
Median across role-level P50 starting salaries; not a population wage average.
1.4978×
General-regime statutory planning multiplier
Illustrative FPAS 515 architecture; validate CNAE, RAT/FAP, benefits and employee facts.
Salary figures are starting-salary benchmarks; employer-cost multiplier is an illustrative statutory planning architecture before benefits, variable compensation and employee-specific facts. Salary benchmark → · Employer-cost benchmark →
Office & housing
São Paulo location economics are materially heterogeneous.
Premium client-facing districts command very different asking rents from Berrini/Brooklin, while furnished executive housing varies sharply by unit size.
R$148.25/m²
São Paulo Class A/A+ average · Q2 2026
Independent asking-rent benchmark; excludes condomínio, IPTU, fit-out and utilities.
R$293.08/m²
Faria Lima asking rent · Q2 2026
Vacancy: 8.97%.
R$105.37/m²
Berrini / Brooklin asking rent · Q2 2026
Vacancy: 9.39%.
25–40 m² furnished selected-listing P50
R$4,282/mo
Selected furnished listing snapshot. Mid-size 45–60 m² P50: R$6,866/month; 70–90 m² P50: R$10,108/month.
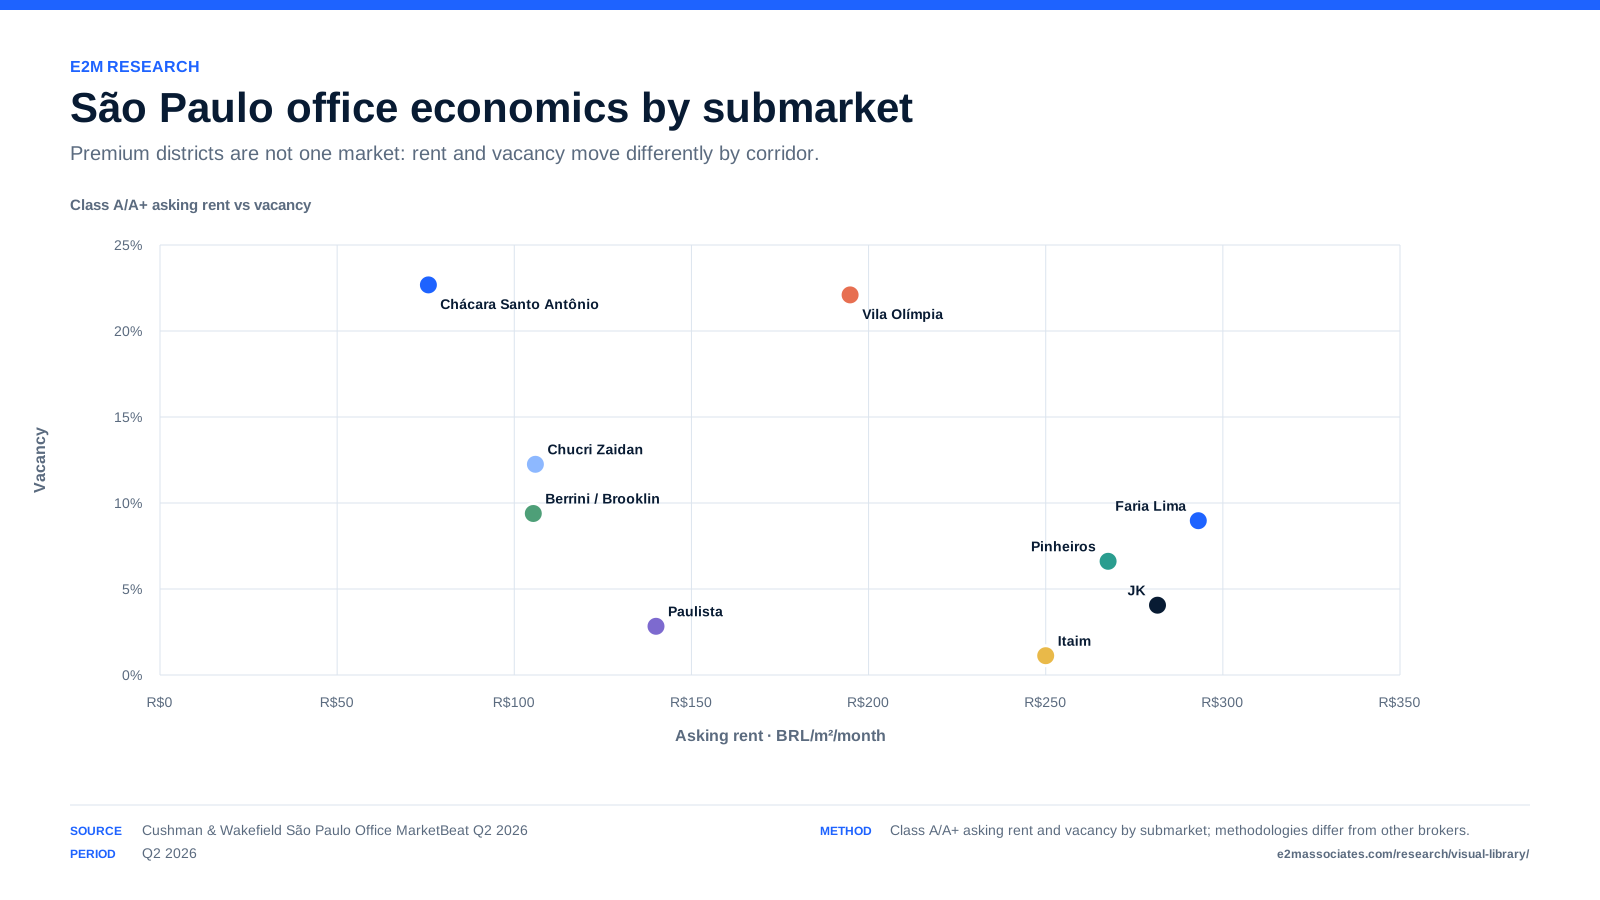
São Paulo office rent vs vacancy
Q2 2026 Class A/A+ benchmark across nine submarkets. Open source research →
Commercial launch
Ninety days can validate a motion; it may not close an enterprise cycle.
The launch benchmark is designed to separate early signal from revenue timing. A software-specific external comparator shows 30–180 days from first demo to contract, depending on segment and complexity.
30–180 days
Software B2B first demo → signed contract
External comparator; software B2B only and not a cross-industry Brazil average.
R$52.9k–68.9k
Lean internal SDR · 90-day scenario
E2M scenario including salary/employer cost plus tools/data and meeting reserve.
R$75k
Observed integrated outsourced launch · 90 days
E2M observed client-facing scoped reference; not a market-average price or output guarantee.
Use the first 90 days to test ICP, message, channel and meeting quality. Do not equate early activity with closed enterprise revenue. Commercial Launch Benchmark →
Watch next
Four items can materially change the Q4 operating picture.
The next edition should update the evidence only when new information is actually available.
August 2026 Novo Caged release
Updates the formal-employment signal after this report cutoff.
São Paulo Q3 office-market data
Current office reference remains Q2 2026.
Selic path and inflation
Cost of capital and price dynamics remain material to commitment timing.
CBS / IBS implementation milestones
Fiscal-document and systems readiness becomes increasingly operational.
Source ledger
Sources, evidence classes and limits
Official facts remain attributable to their original publishers. E2M benchmarks, scenarios and calculations retain their own evidence labels and caveats.
S1 · IBGE — Quarterly National Accounts, Q2 2026Brazil GDP: +0.5% quarter-on-quarter and +2.0% year-on-year in Q2 2026. · Evidence: A · Open source →
S2 · IBGE — IPCA, August 2026IPCA: -0.32% in August 2026 and +4.22% over 12 months. · Evidence: A · Open source →
S3 · Banco Central do Brasil — September 2026 monetary policySelic reduced to 13.75% p.a.; BCB described uncertainty and risks around the base scenario as elevated. · Evidence: A · Open source →
S4 · Ministry of Labour — Novo Caged, July 2026+58,568 net formal jobs in July; +972,203 year to date; 48,082,866 formal employment relationships. · Evidence: A · Open source →
S5 · Receita Federal — 2026 consumption-tax reform guidance2026 is a test year for CBS and IBS; fiscal-document and declaration rules determine collection dispensation during the test phase. · Evidence: A · Open source →
E1 · E2M Research — Brazil Market Entry Cost Benchmark 2026Scenario-based 90-day and 12-month entry architectures. · Evidence: Mixed B/C/D · Open source →
E2 · E2M Research — Brazil Market Entry Timeline Benchmark 2026Operational planning ranges by entry model. · Evidence: Mixed · Open source →
E3 · E2M Research — Brazil Salary Benchmark 202643-role starting-salary benchmark; São Paulo primary market. · Evidence: B · Open source →
E4 · E2M Research — Brazil Employer Cost Benchmark 2026Planning multipliers for standard CLT employer-cost architecture. · Evidence: A-based model · Open source →
E5 · E2M Research — São Paulo Office Cost Index 2026Q2 2026 Class A/A+ asking rents and vacancy by submarket. · Evidence: B · Open source →
E6 · E2M Research — São Paulo Corporate Housing Index 2026Selected furnished-listing bands; not a citywide probability sample. · Evidence: C/E calculation · Open source →
E7 · E2M Research — Brazil Commercial Launch Benchmark 2026B2B launch sequencing, budget scenarios and software-cycle comparator. · Evidence: Mixed B/D · Open source →
How to read this report
This report is decision support, not legal, tax, investment or employment advice. It mixes official facts, independent benchmarks and explicitly labeled E2M planning scenarios; they should not be cited as if they were the same evidence class.
Methodology → · Editorial standards → · Freshness & change monitor → · Machine-readable report data →