Home / E2M Research / Visual library
ORIGINAL VISUAL RESEARCH

Visual research library

Charts and decision graphics built to be read, reused and cited.

Every visual preserves its source, period and method. Web masters are SVG; social and media exports are PNG. The first release covers the highest-value E2M benchmarks and decision frameworks.

13 visualsSVG + PNGSource · period · methodWeb · social · media
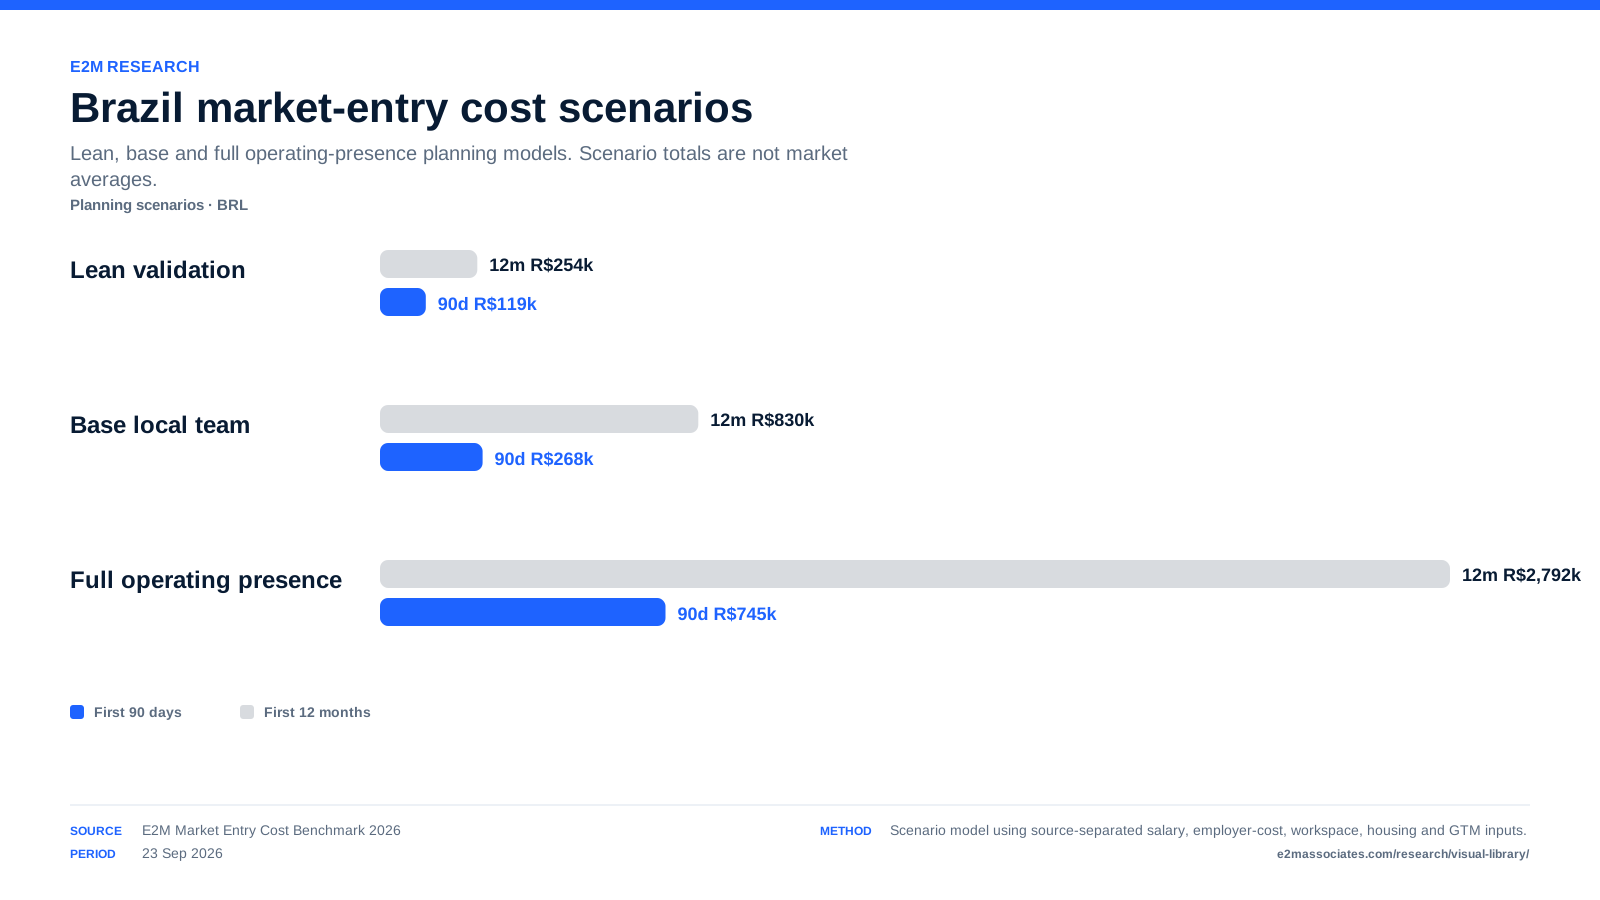
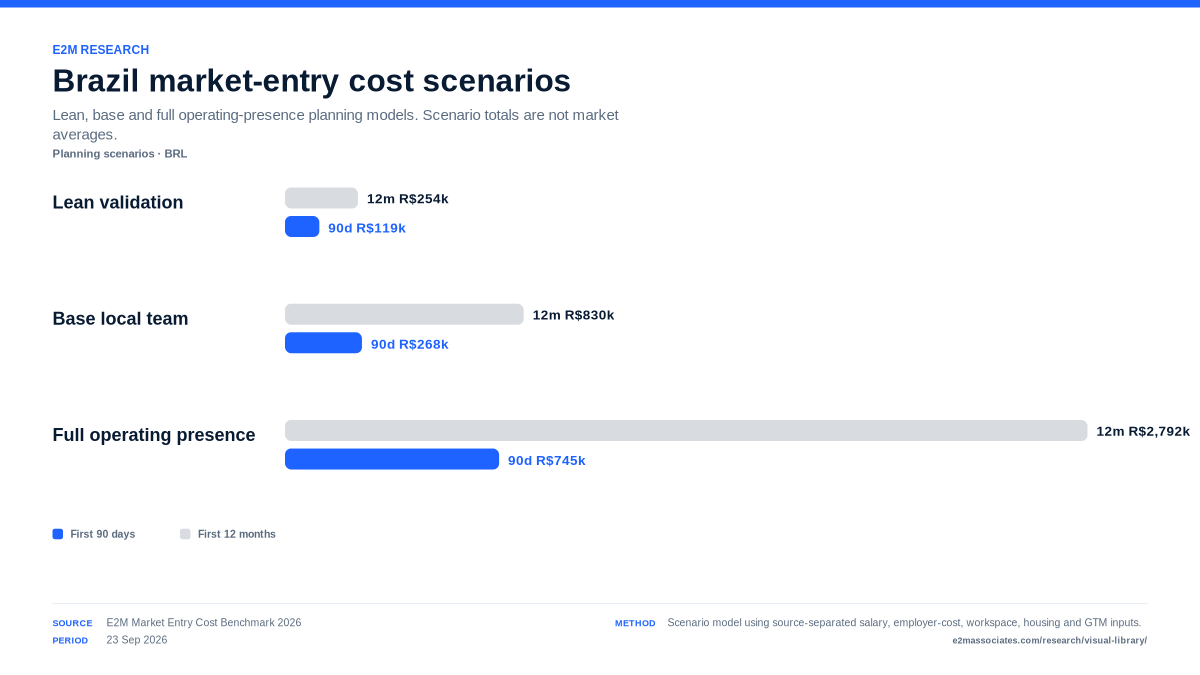
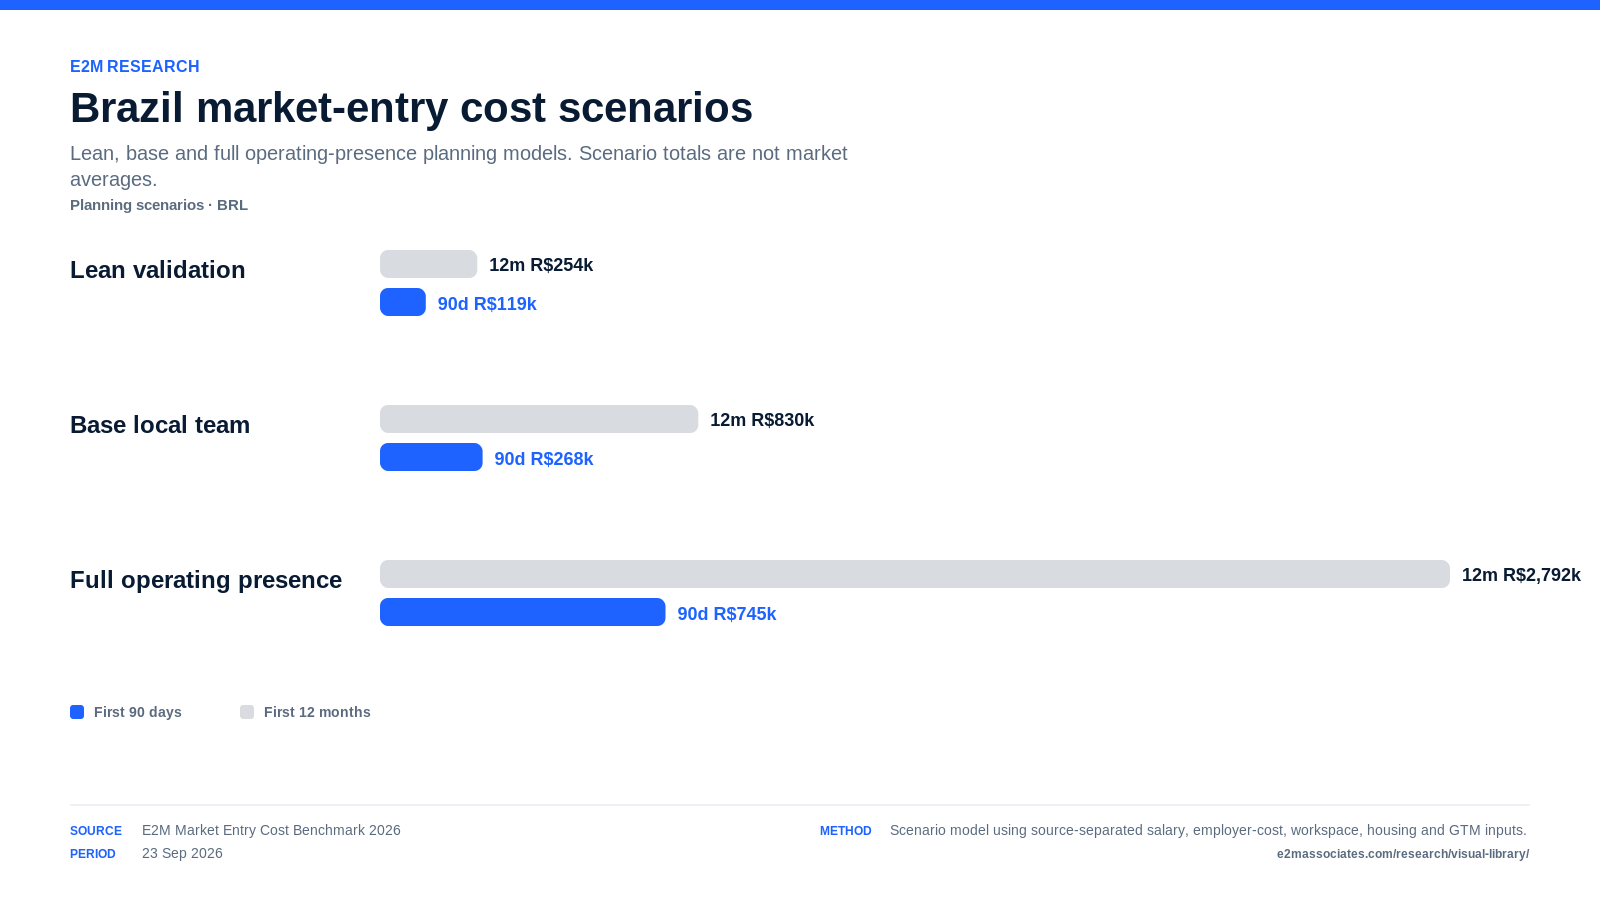
Grouped bars compare first-90-day and first-12-month costs for lean, base and full Brazil market-entry scenarios.
CHARTS

Brazil Market-Entry Cost Scenarios 2026

Source: E2M Market Entry Cost Benchmark 2026
Period: 23 Sep 2026
Method: Scenario model; totals are planning architectures, not market averages.

E2M Research. Brazil Market-Entry Cost Scenarios 2026. 23 Sep 2026. /brazil-market-entry-cost/
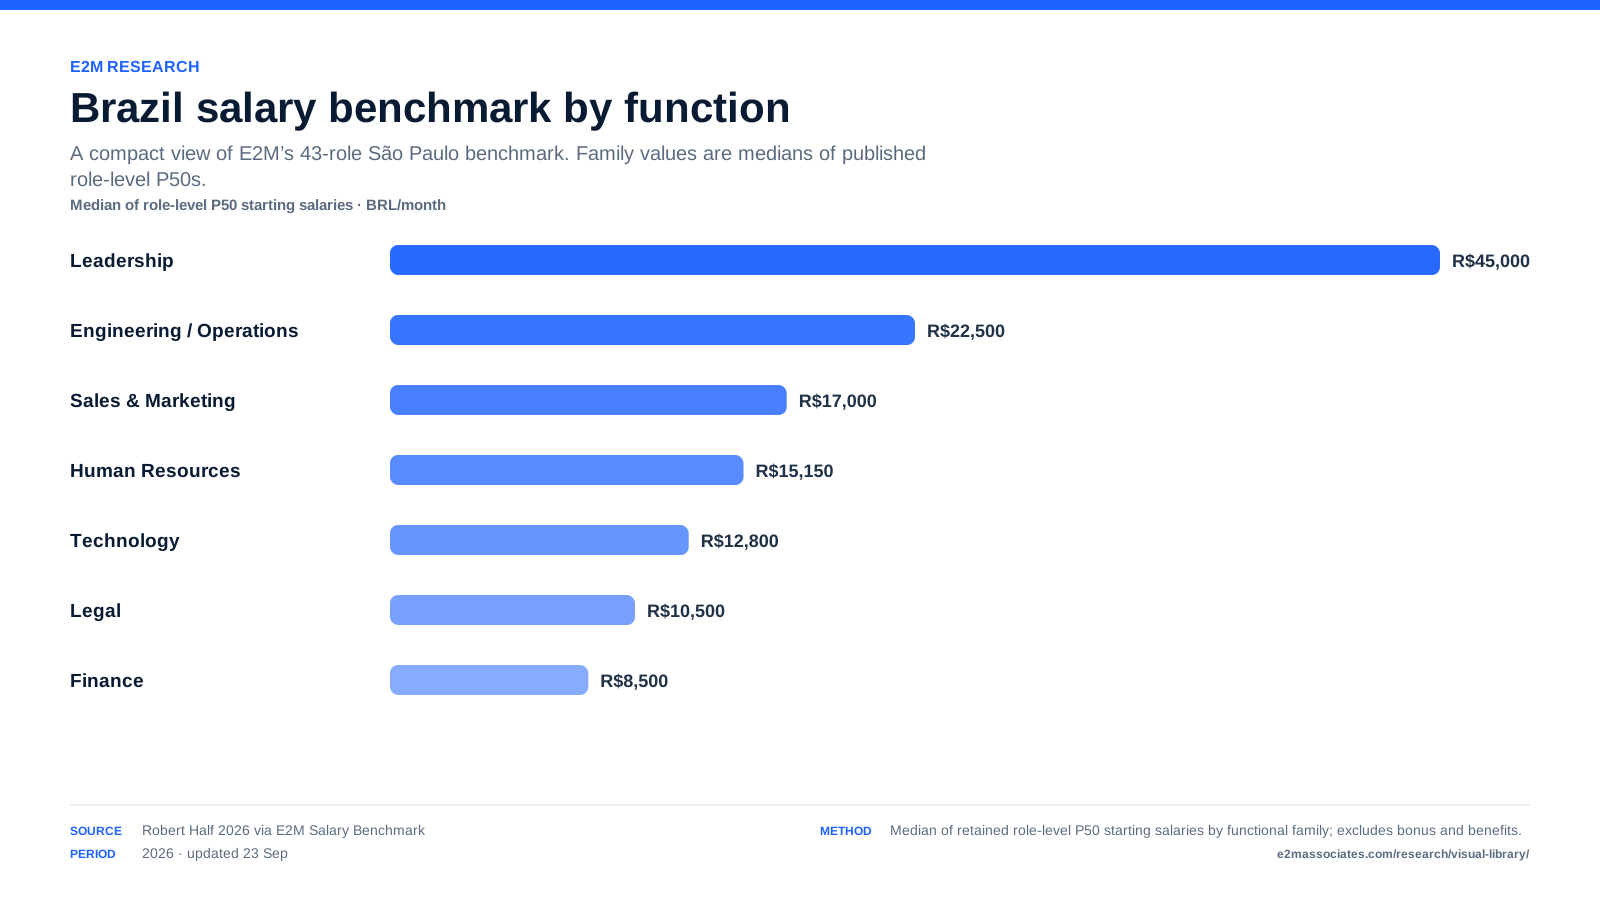
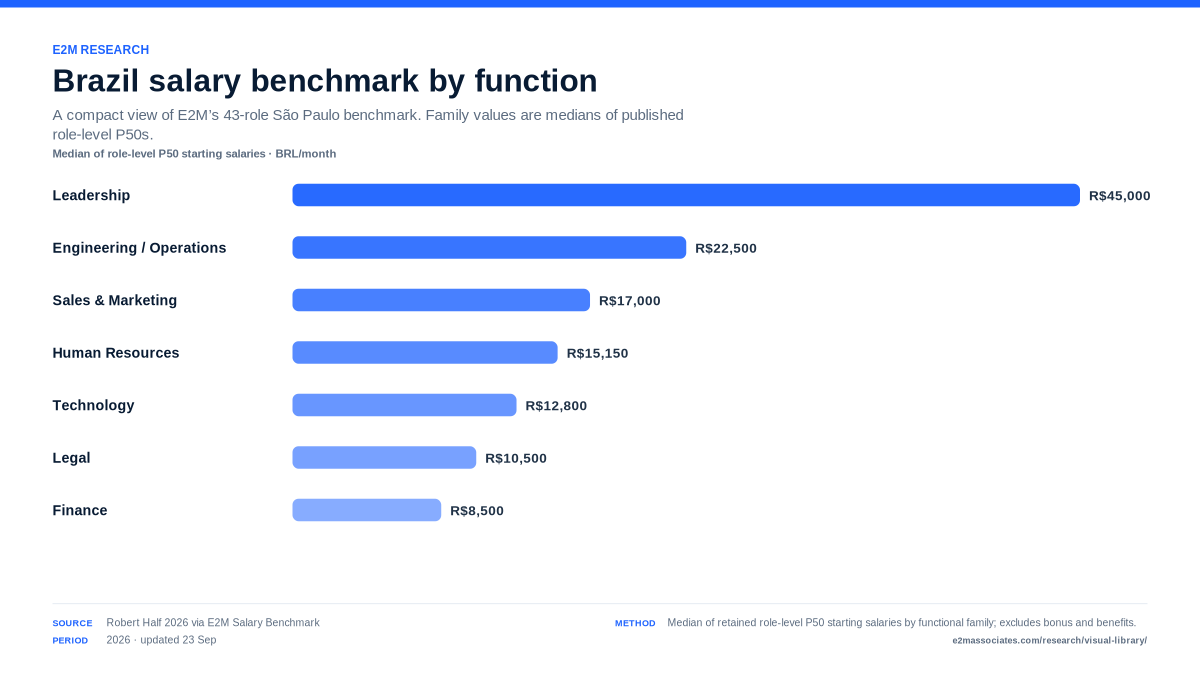
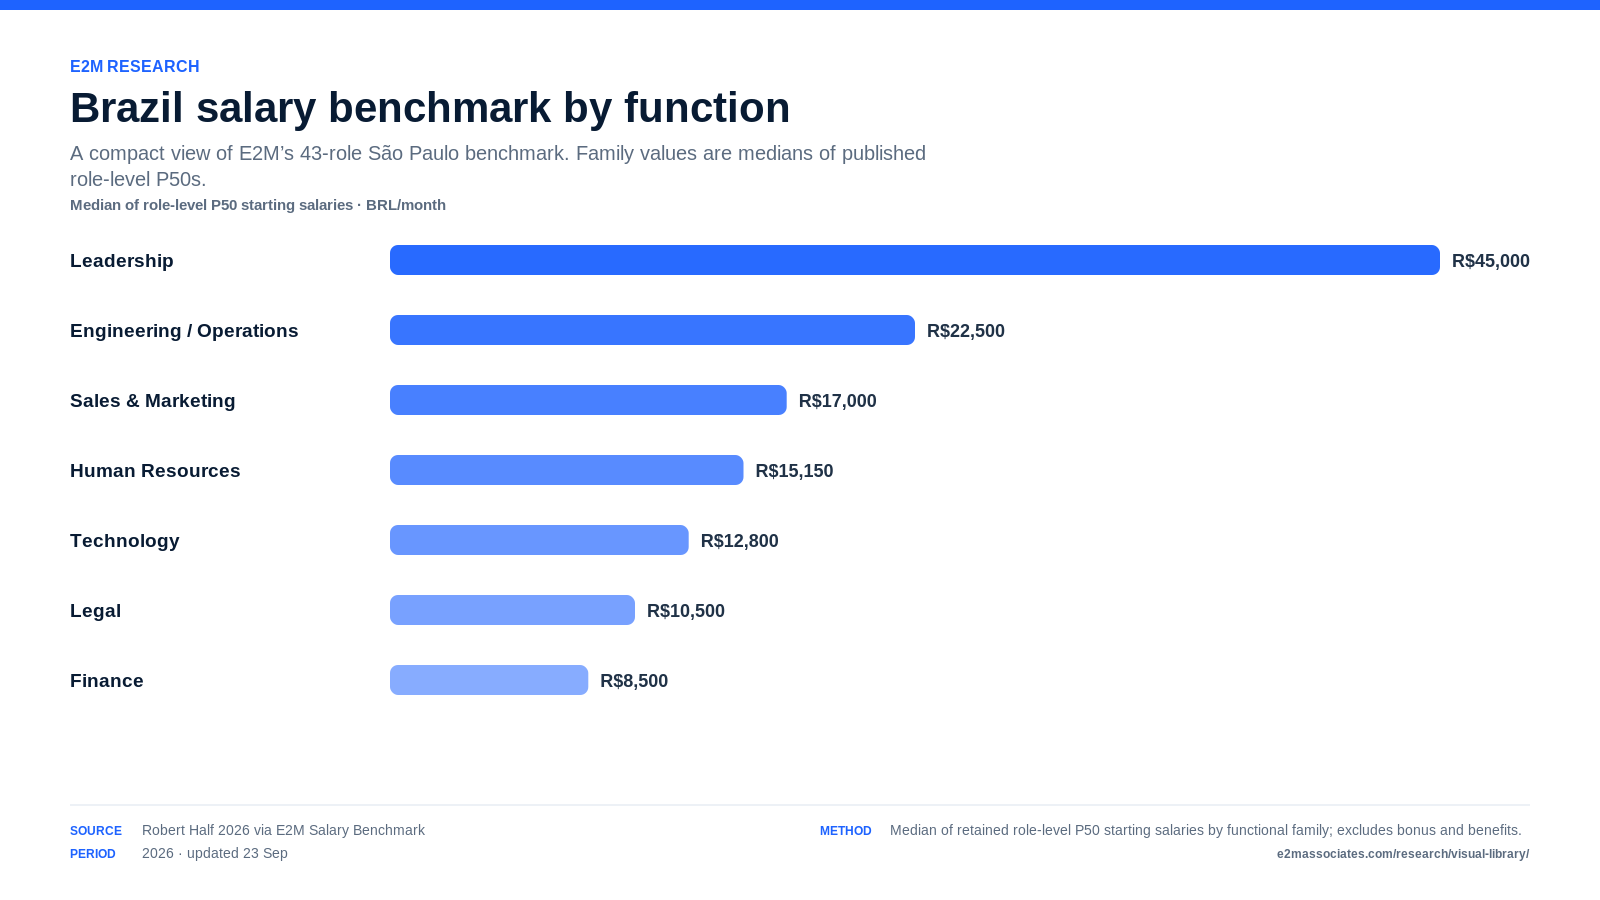
Horizontal bars show P50 monthly starting salaries by functional family in São Paulo.
CHARTS

Brazil Salary Benchmark — Family P50 Medians

Source: Robert Half 2026 via E2M Salary Benchmark
Period: 2026 · updated 23 Sep
Method: Median of role-level P50 starting salaries; not a market-wide family average.

E2M Research. Brazil Salary Benchmark — Family P50 Medians. 2026 · updated 23 Sep. /brazil-salary-benchmark/
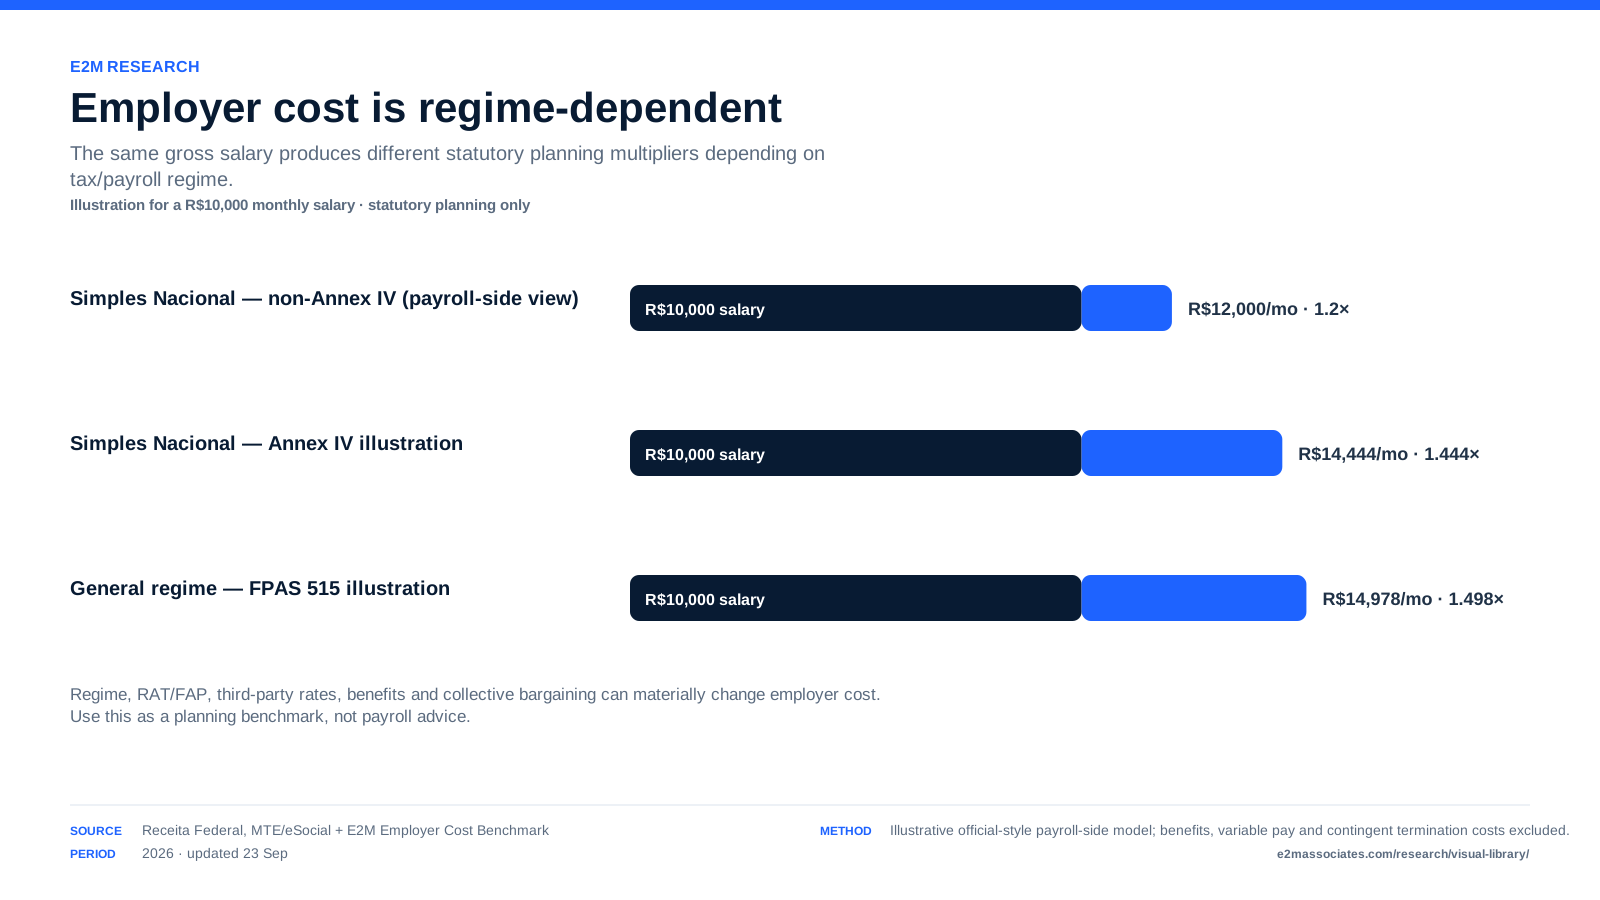
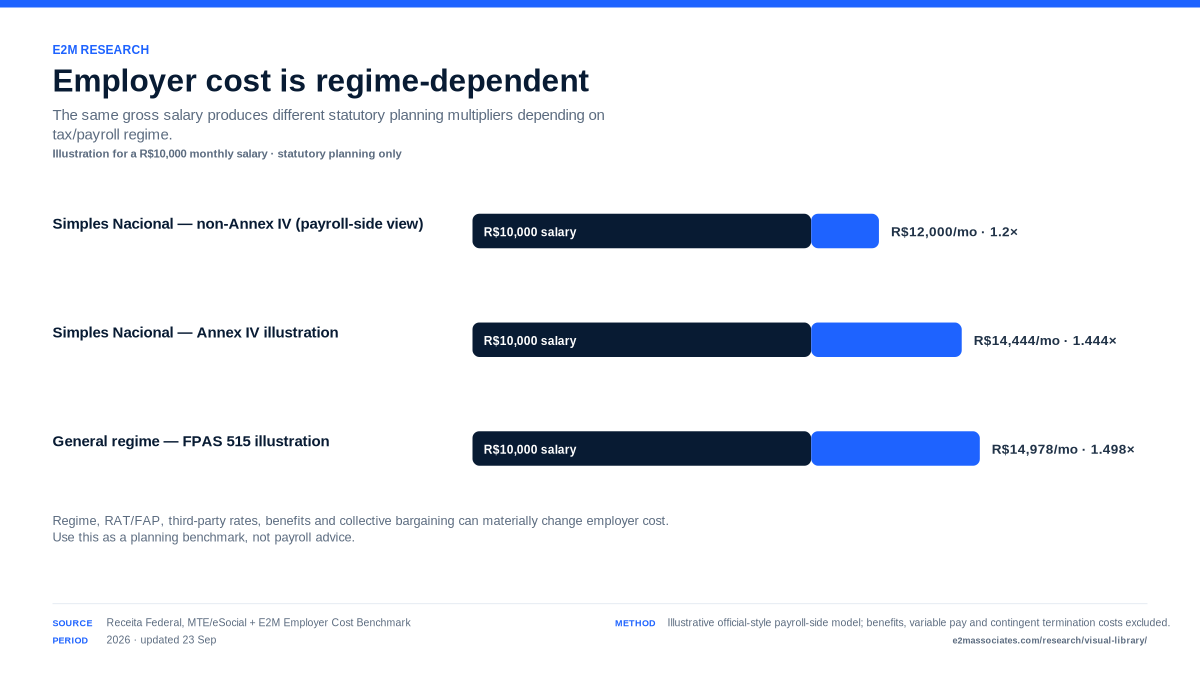
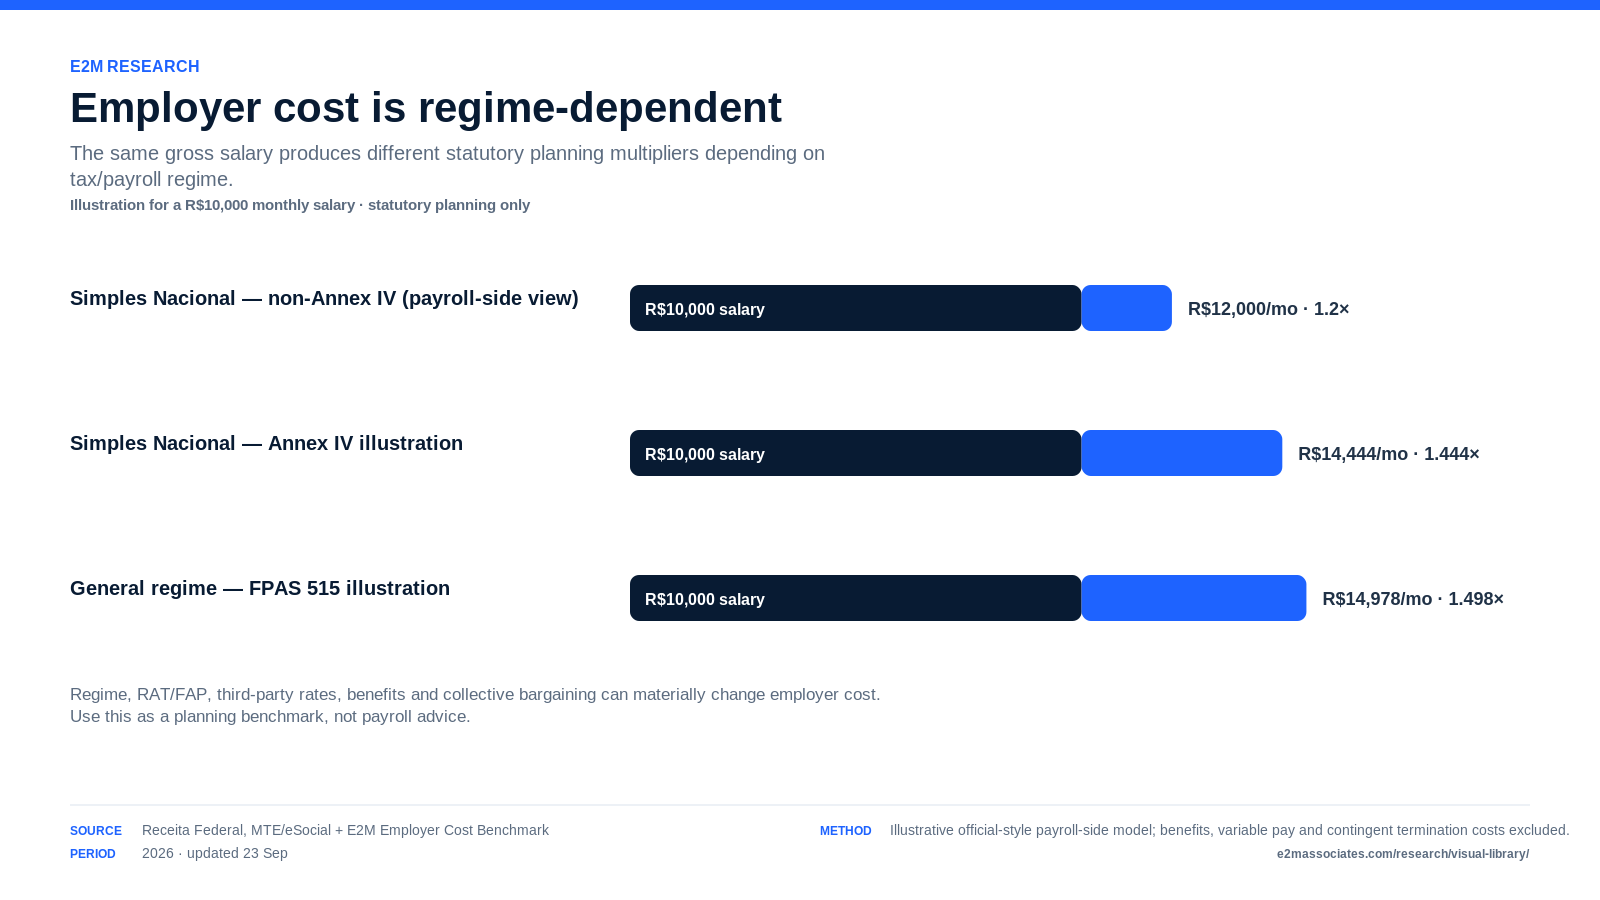
Bars compare statutory employer-cost illustrations across selected Brazilian tax and payroll regimes.
CHARTS

Brazil Employer Cost — Regime Illustrations

Source: Receita Federal, MTE/eSocial + E2M benchmark
Period: 2026 · updated 23 Sep
Method: R$10k salary illustration; regime-specific statutory planning factors, not universal payroll multipliers.

E2M Research. Brazil Employer Cost — Regime Illustrations. 2026 · updated 23 Sep. /brazil-employer-cost-benchmark/
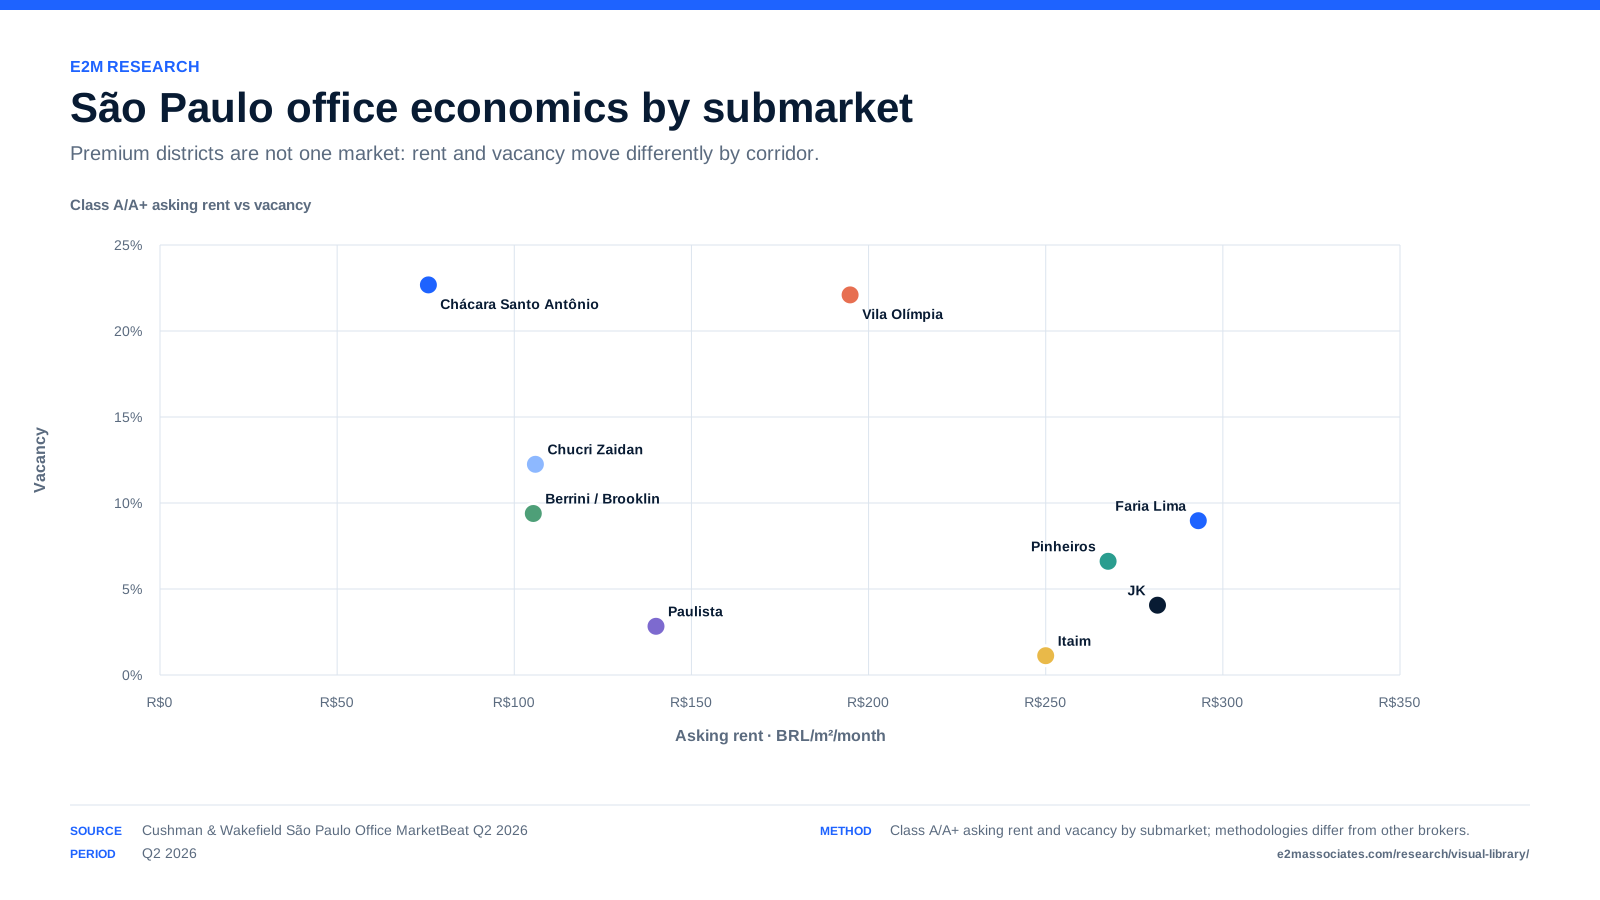
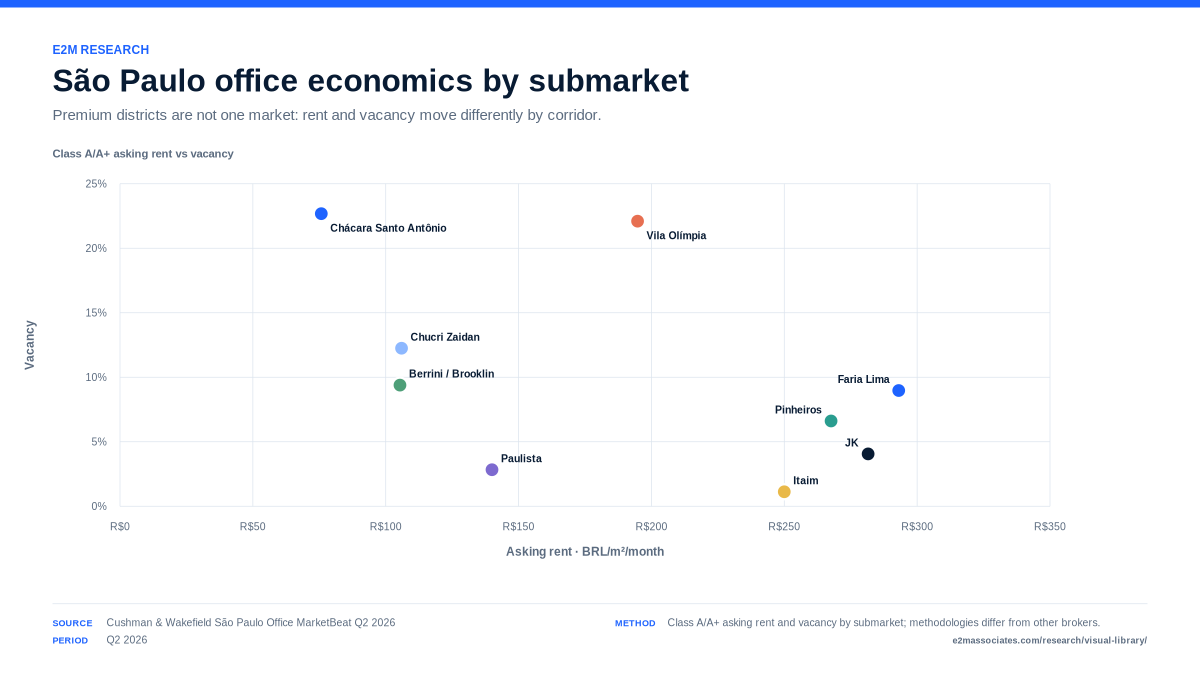
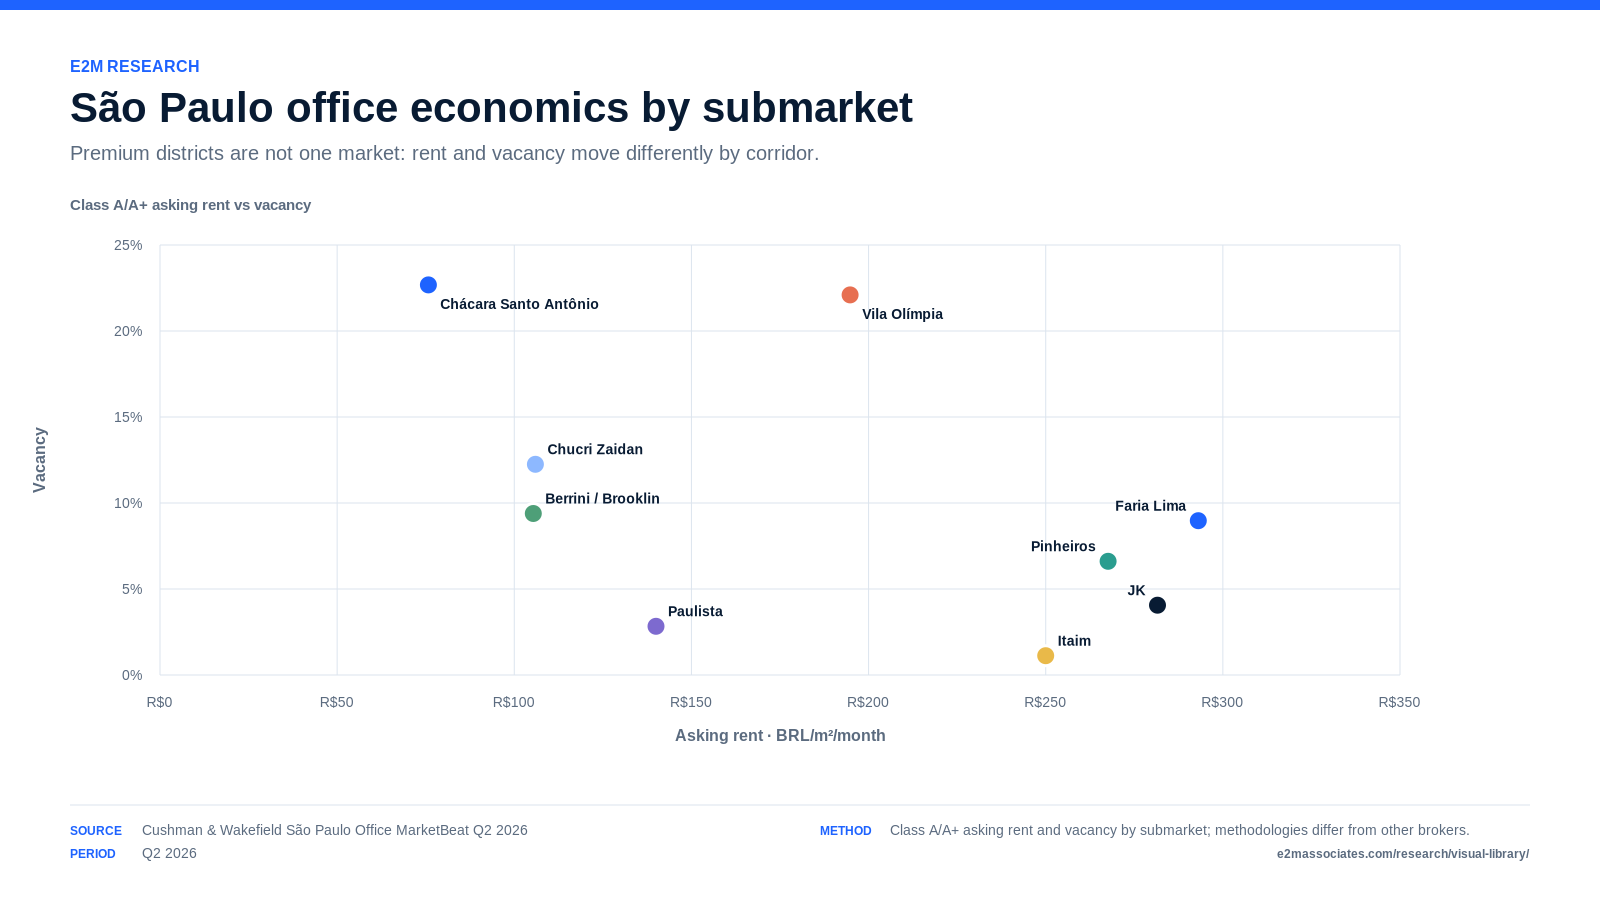
Scatter plot compares asking rent and vacancy across nine São Paulo office submarkets in Q2 2026.
CHARTS

São Paulo Office Rent vs Vacancy — Q2 2026

Source: Cushman & Wakefield MarketBeat Q2 2026
Period: Q2 2026
Method: Scatter of published Class A/A+ asking rent and vacancy by submarket.

E2M Research. São Paulo Office Rent vs Vacancy — Q2 2026. Q2 2026. /sao-paulo-office-cost-index/
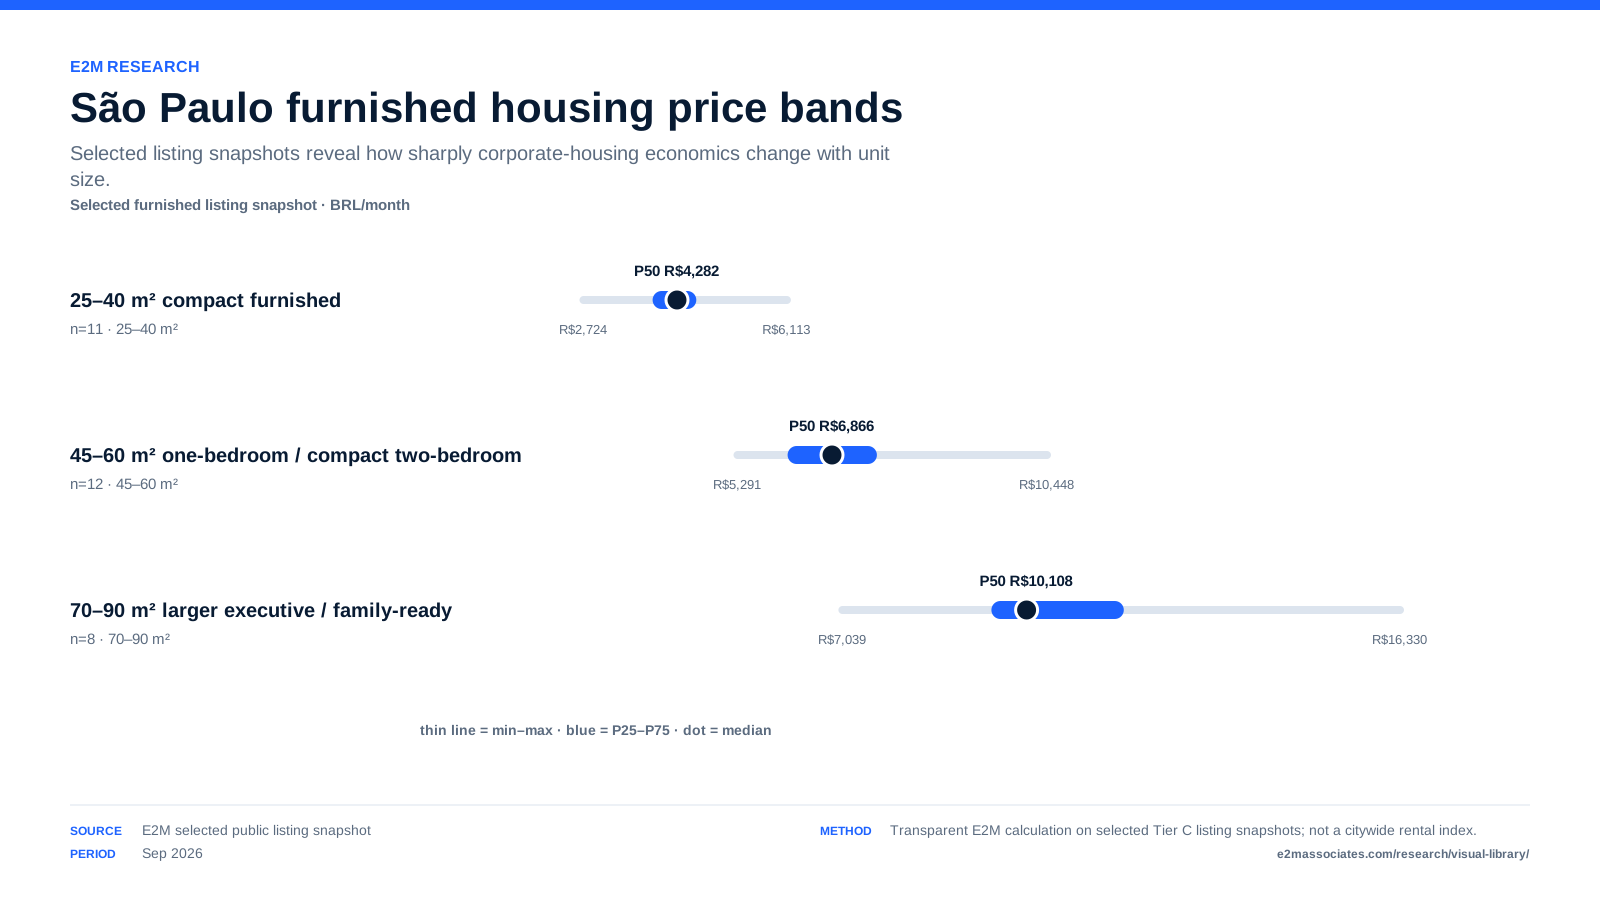
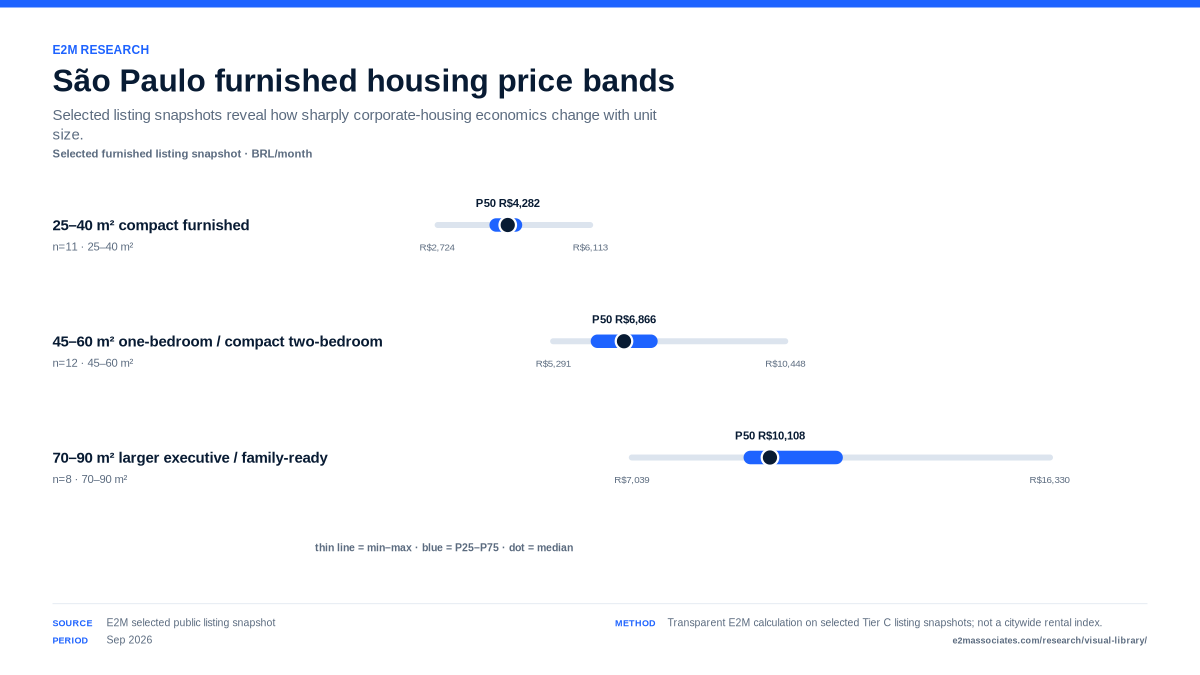
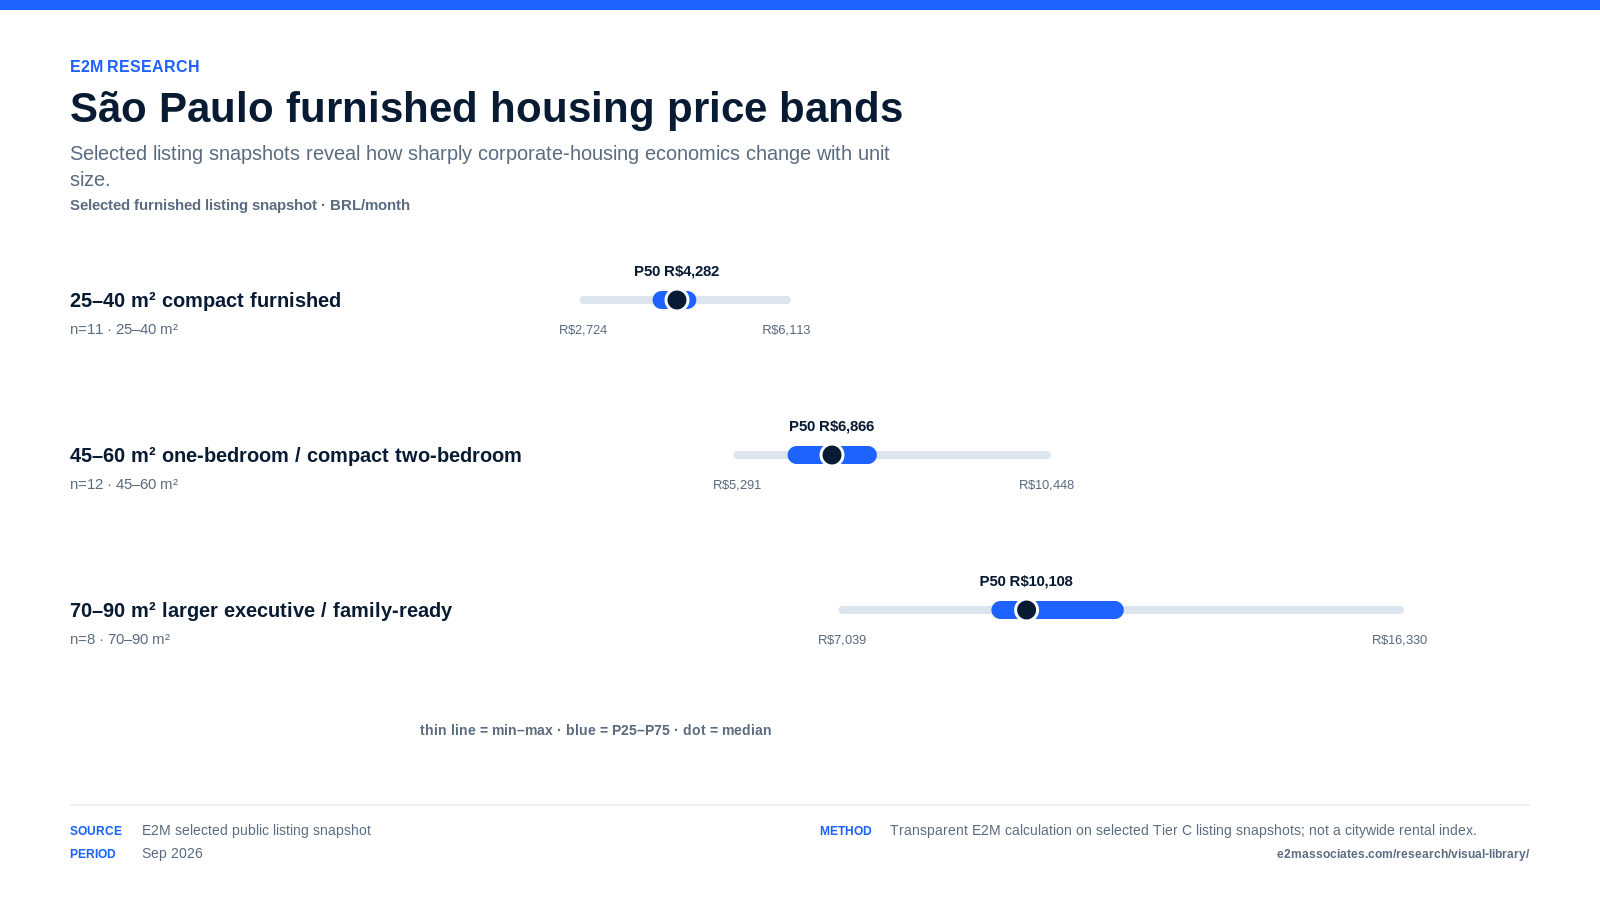
Range bars compare furnished monthly housing price bands by executive unit size in São Paulo.
CHARTS

São Paulo Corporate Housing — Furnished Price Bands

Source: E2M selected public listing snapshot
Period: Sep 2026
Method: P25/P50/P75 and min/max of selected furnished listings by size band; not a citywide average.

E2M Research. São Paulo Corporate Housing — Furnished Price Bands. Sep 2026. /sao-paulo-corporate-housing-index/
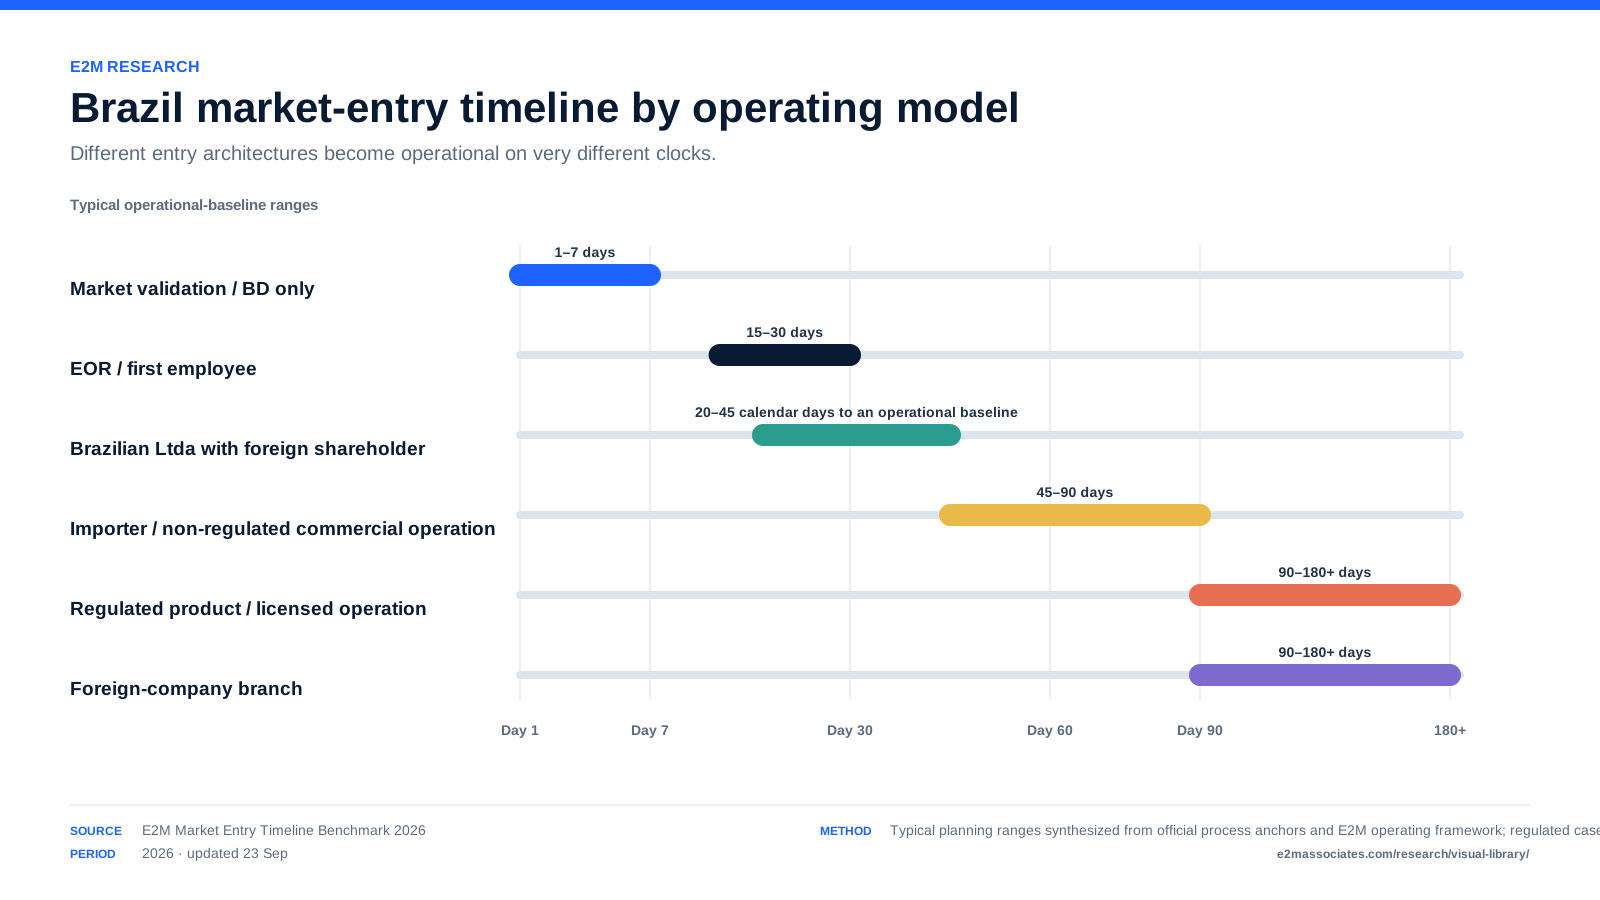
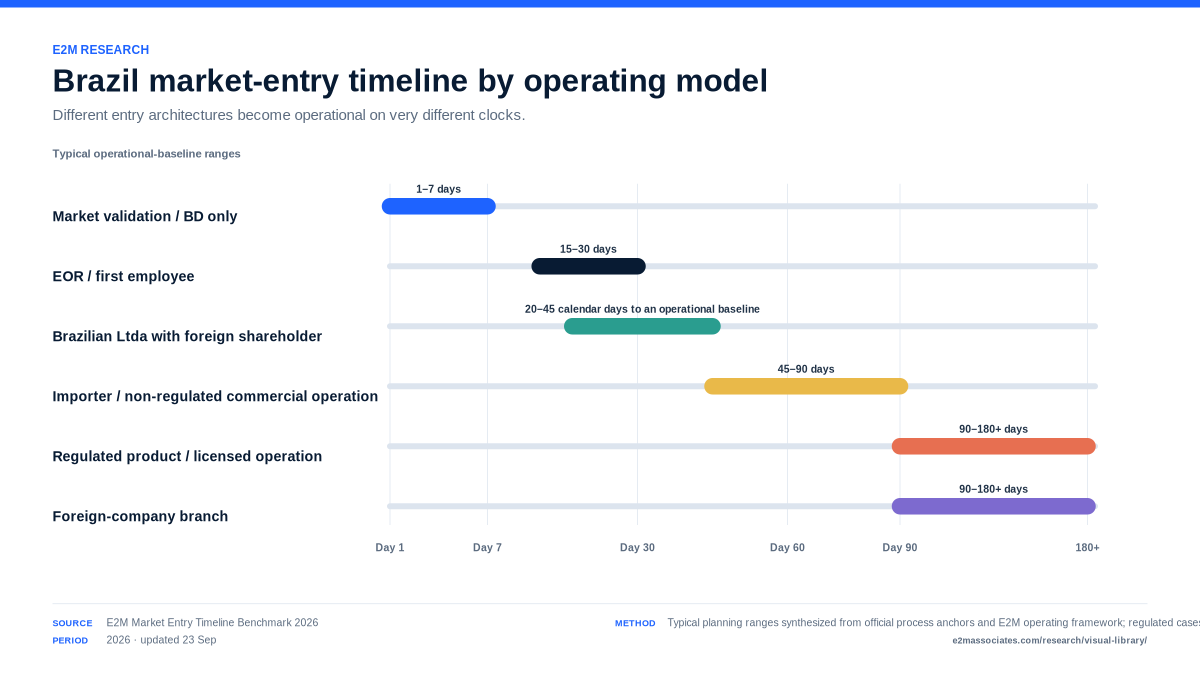
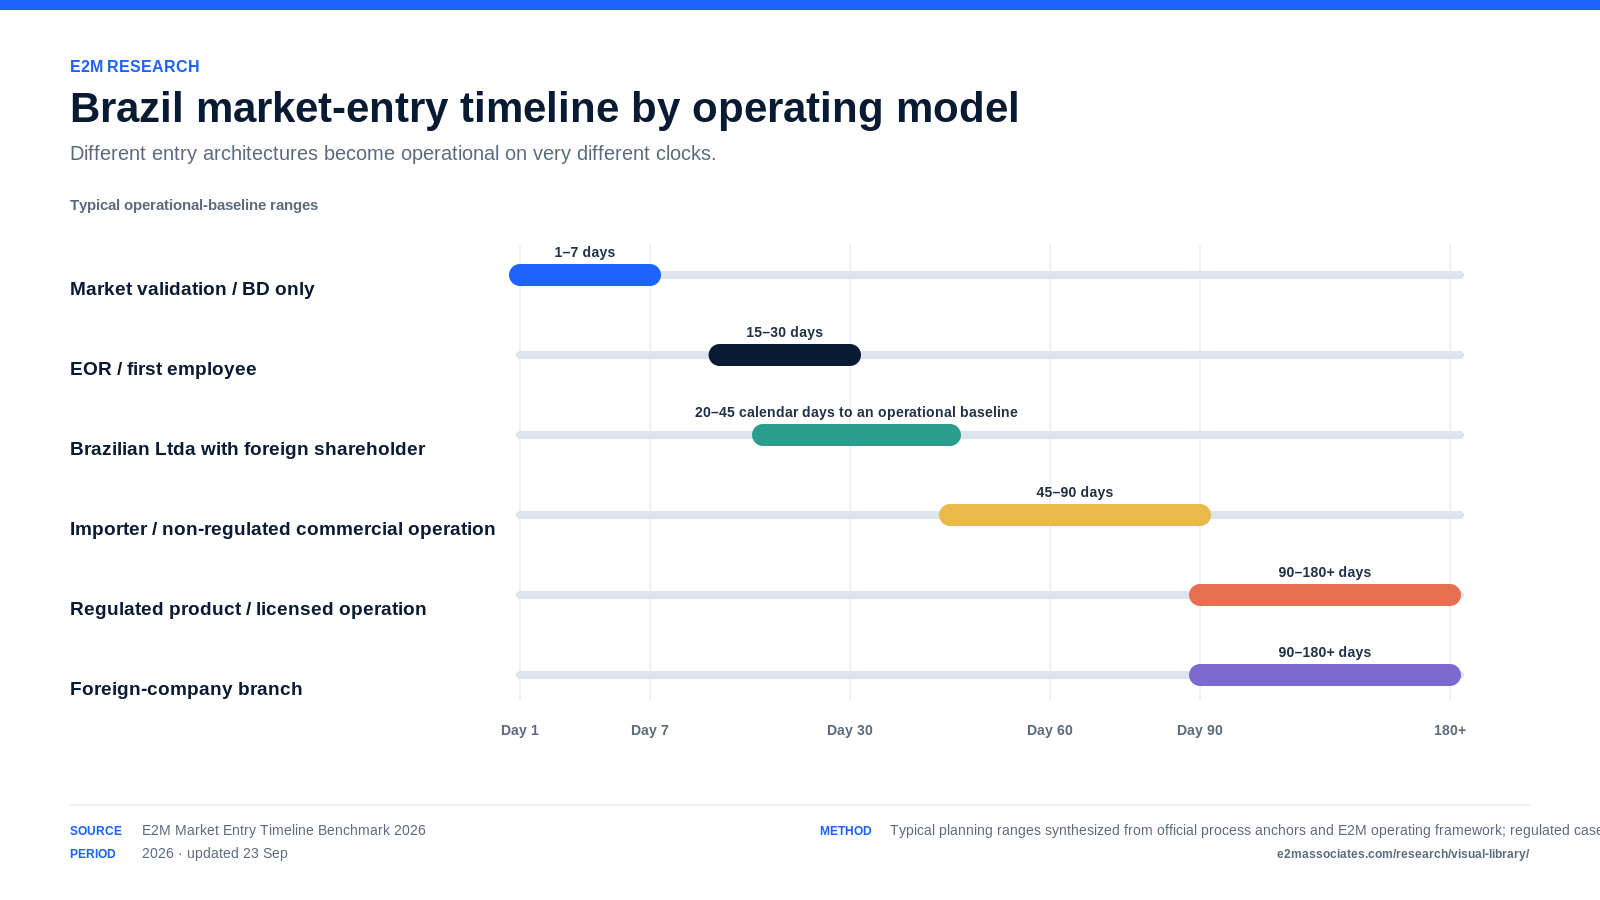
Timeline compares typical operating-baseline ranges for six Brazil market-entry models.
TIMELINES

Brazil Market-Entry Timeline by Operating Model

Source: E2M Market Entry Timeline Benchmark 2026
Period: 2026 · updated 23 Sep
Method: Typical planning ranges from official process anchors and E2M operating framework.

E2M Research. Brazil Market-Entry Timeline by Operating Model. 2026 · updated 23 Sep. /brazil-market-entry-timeline/
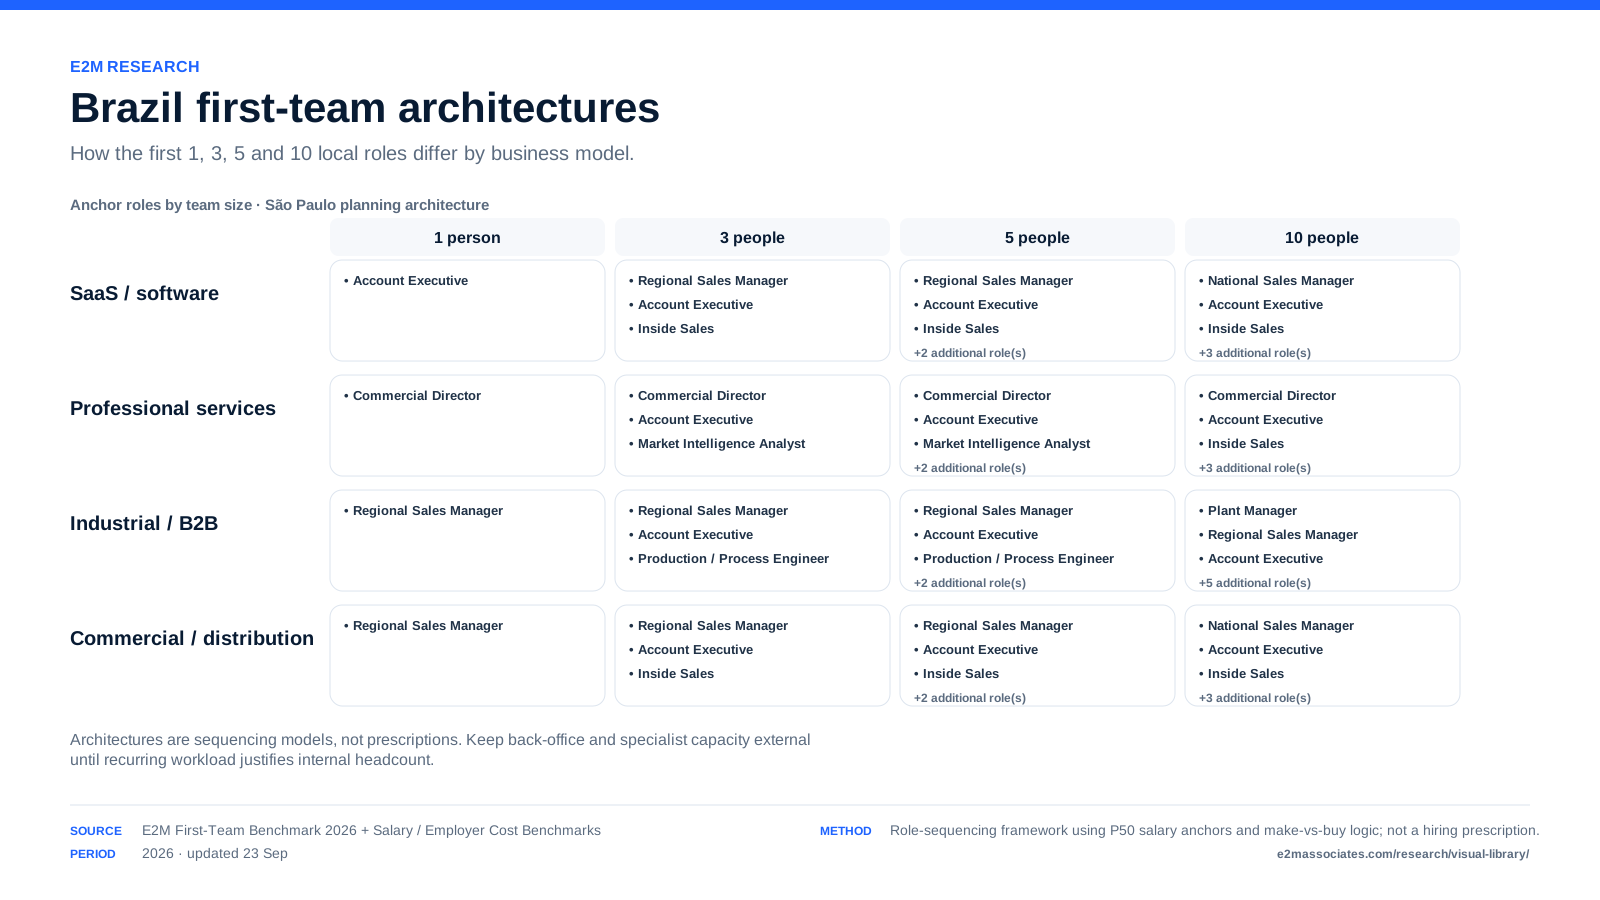
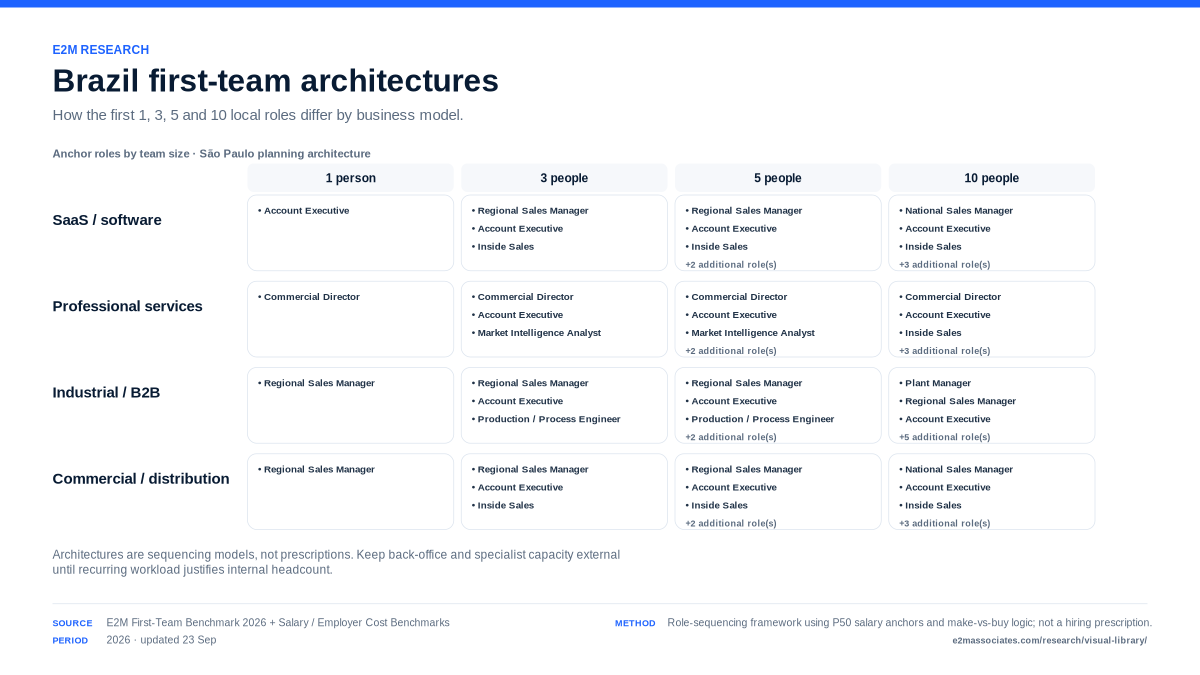
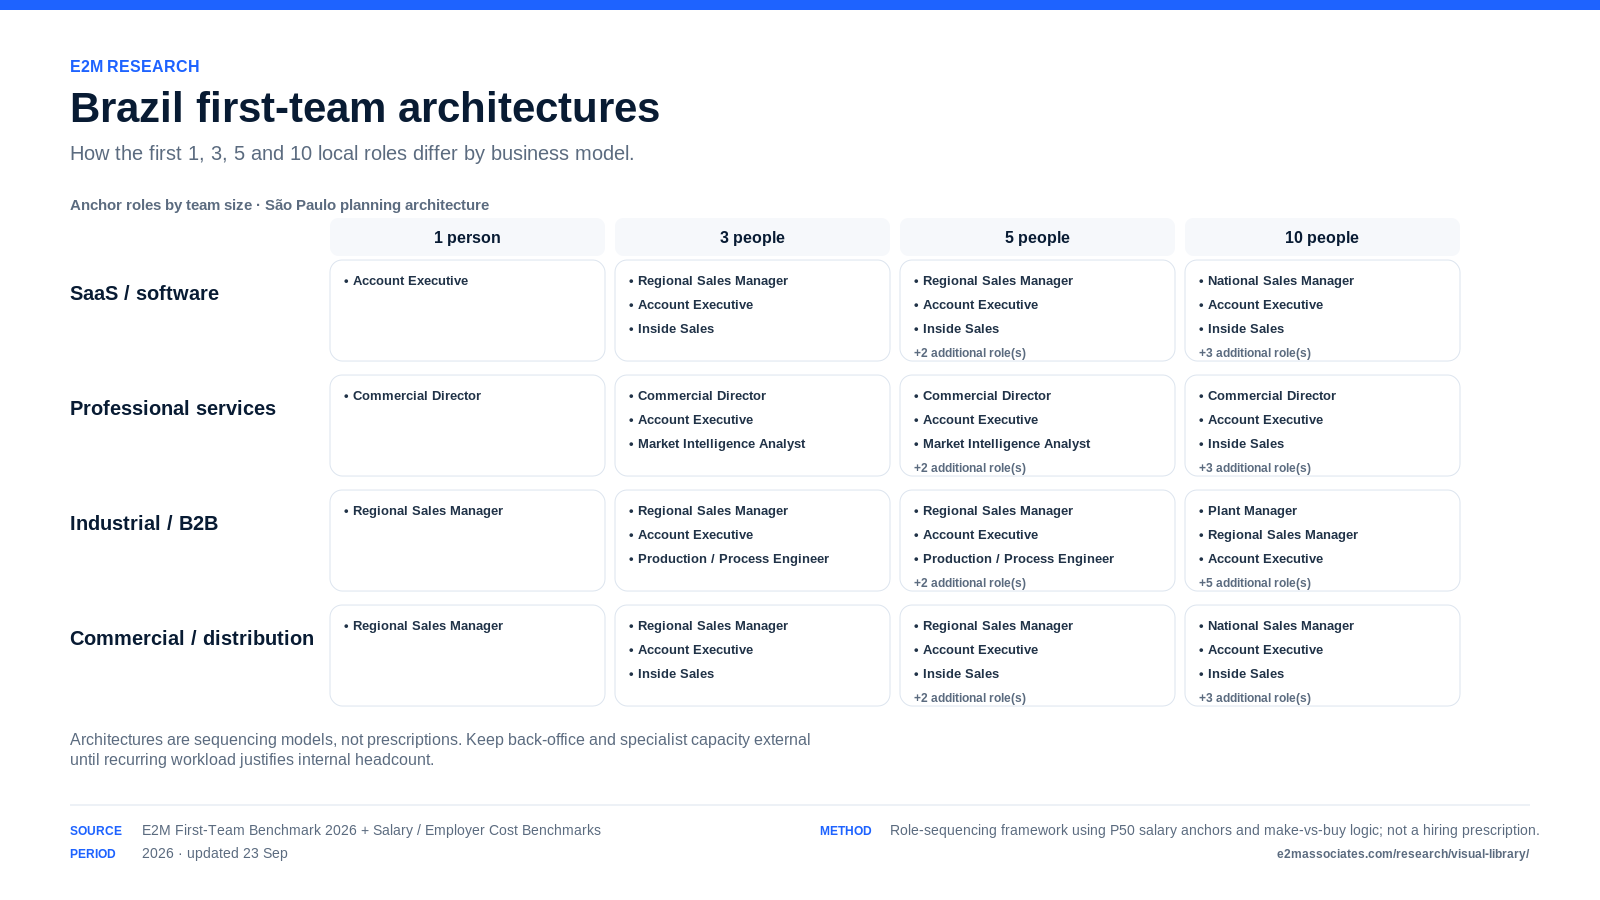
Matrix maps anchor roles for 1-, 3-, 5- and 10-person Brazil teams across four business profiles.
MATRICES

Brazil First-Team Architecture Matrix 2026

Source: E2M First-Team Benchmark 2026
Period: 2026 · updated 23 Sep
Method: Role-sequencing matrix; planning model, not a hiring prescription.

E2M Research. Brazil First-Team Architecture Matrix 2026. 2026 · updated 23 Sep. /brazil-first-team-benchmark/
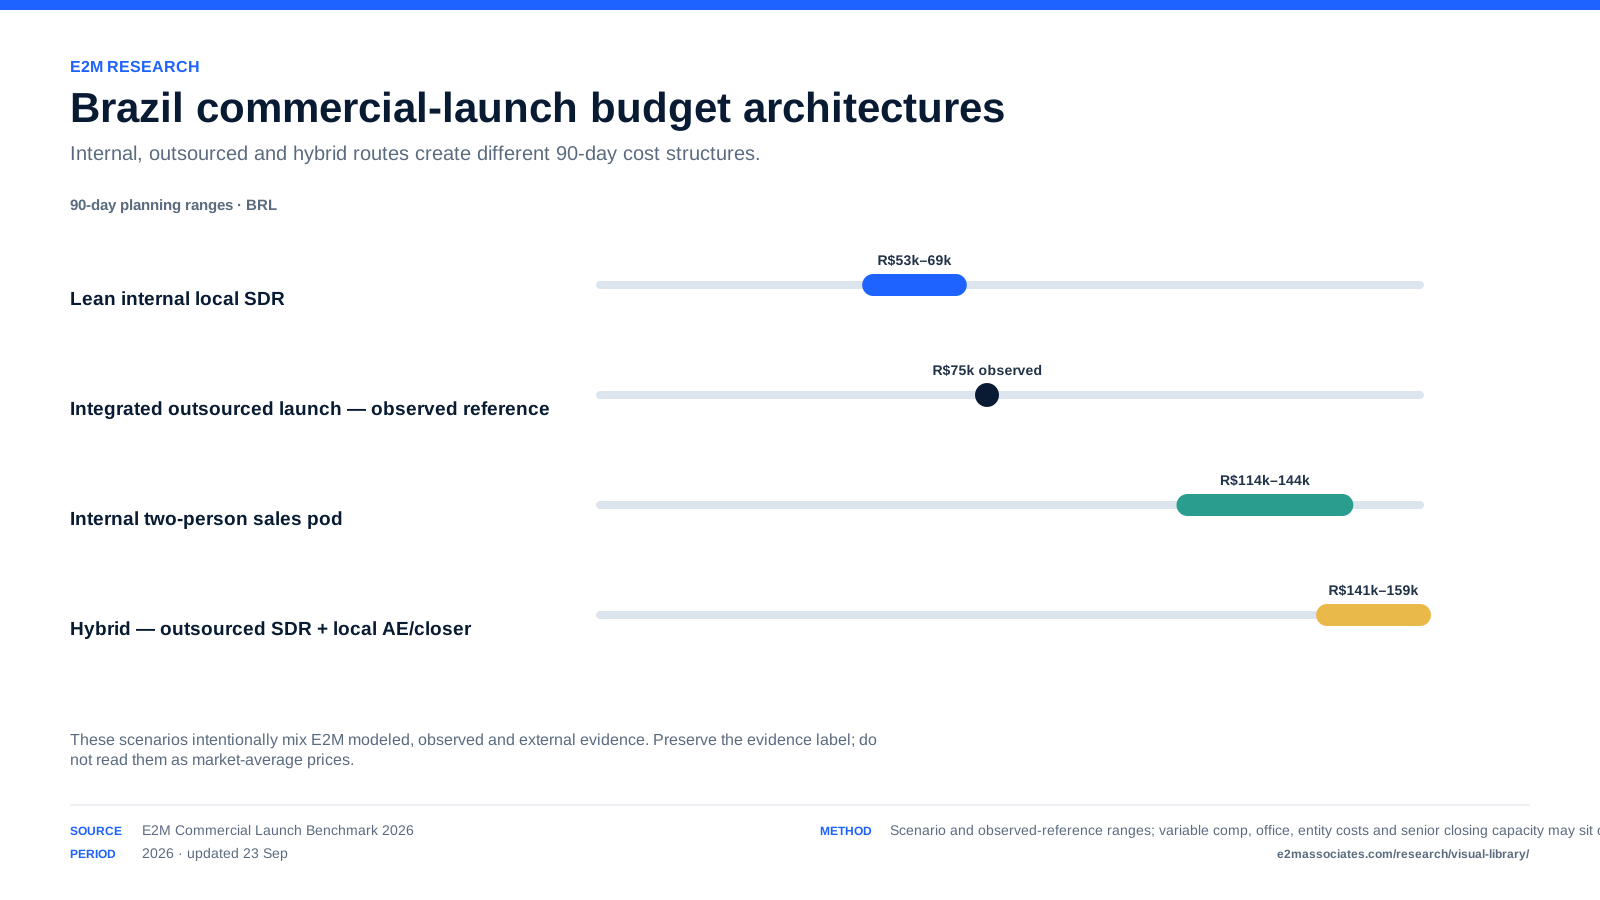
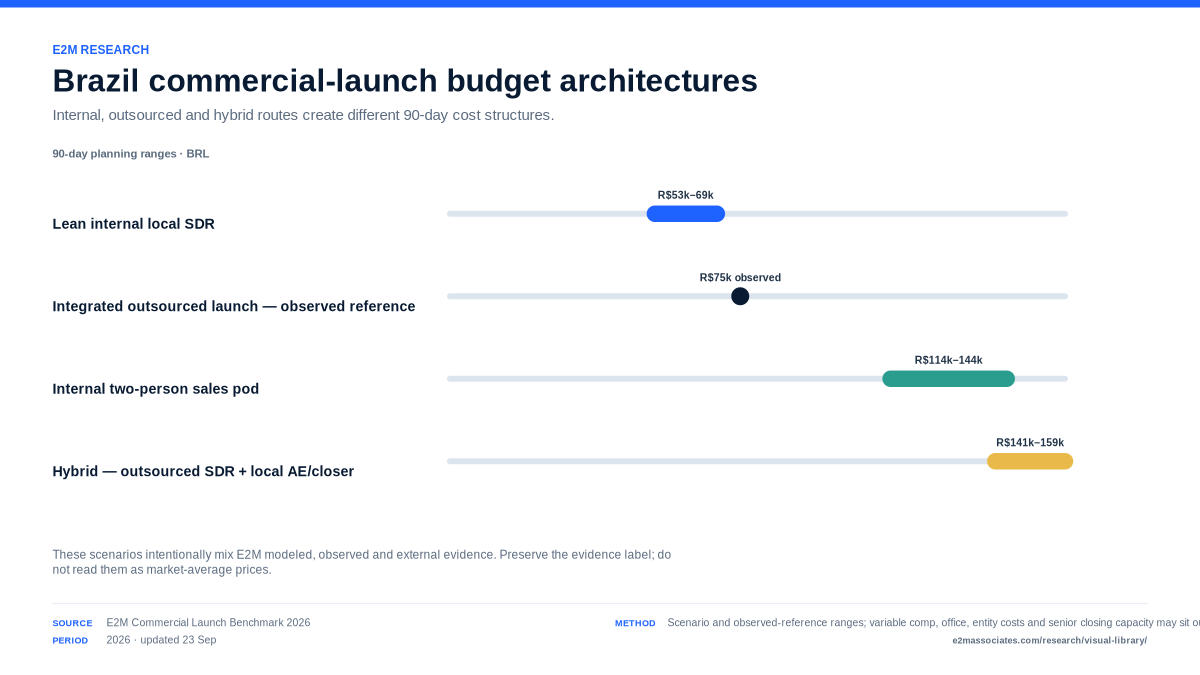
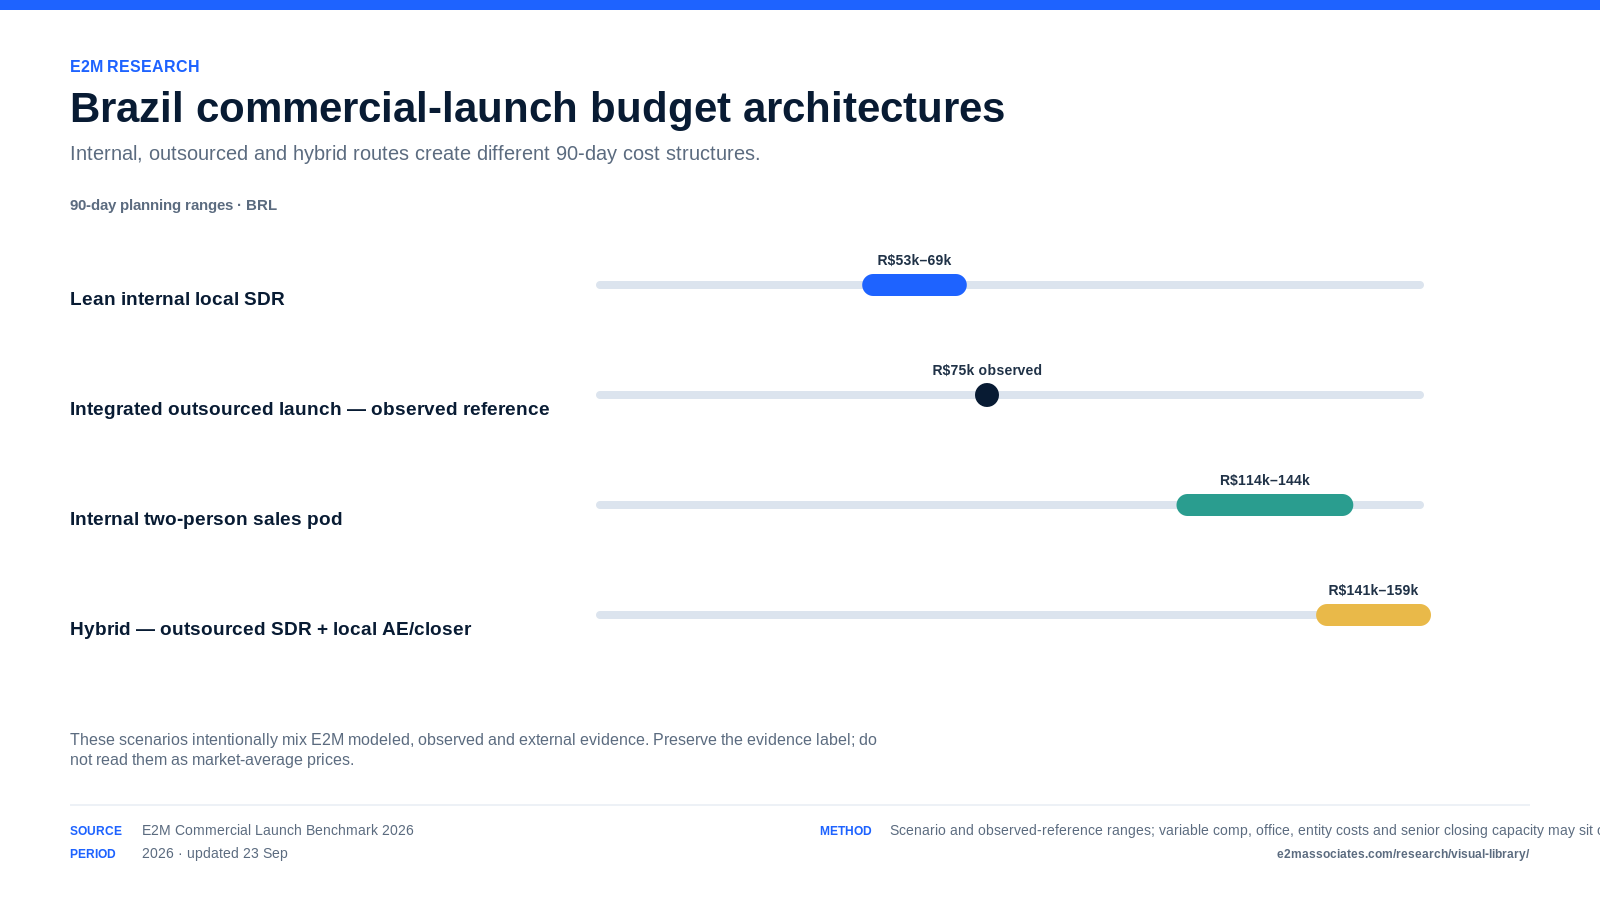
Range chart compares 90-day internal, outsourced and hybrid commercial-launch budget architectures in Brazil.
CHARTS

Brazil Commercial Launch — 90-Day Budget Architectures

Source: E2M Commercial Launch Benchmark 2026
Period: 2026 · updated 23 Sep
Method: Scenario/observed-reference ranges; not market-average pricing.

E2M Research. Brazil Commercial Launch — 90-Day Budget Architectures. 2026 · updated 23 Sep. /brazil-commercial-launch-benchmark/
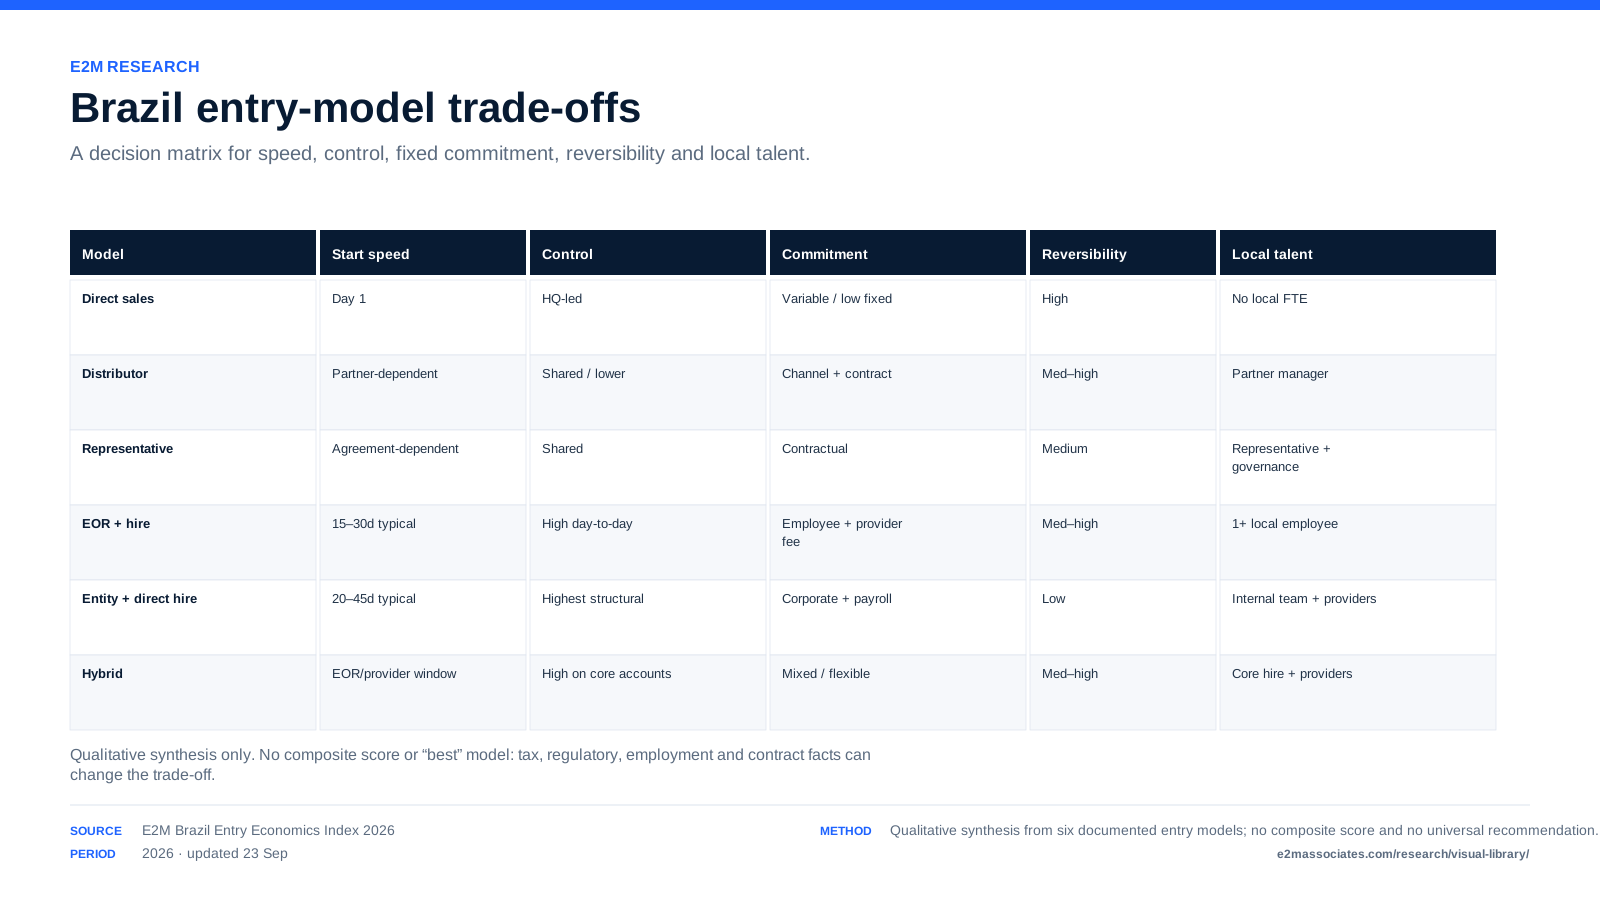
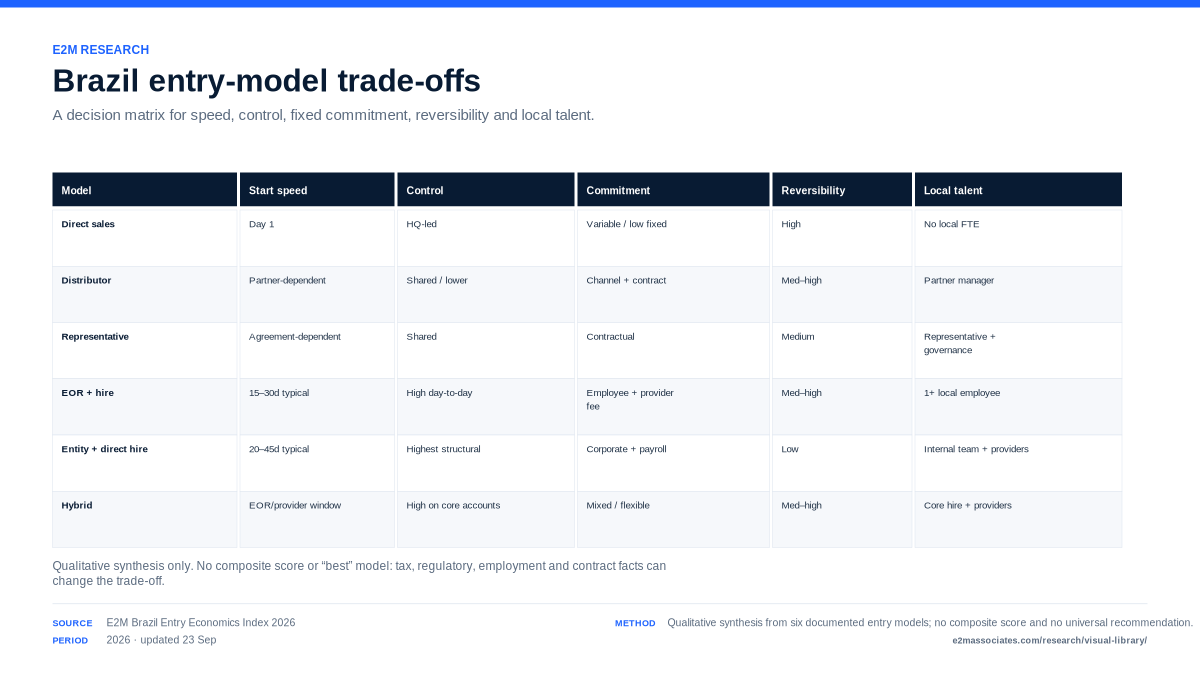
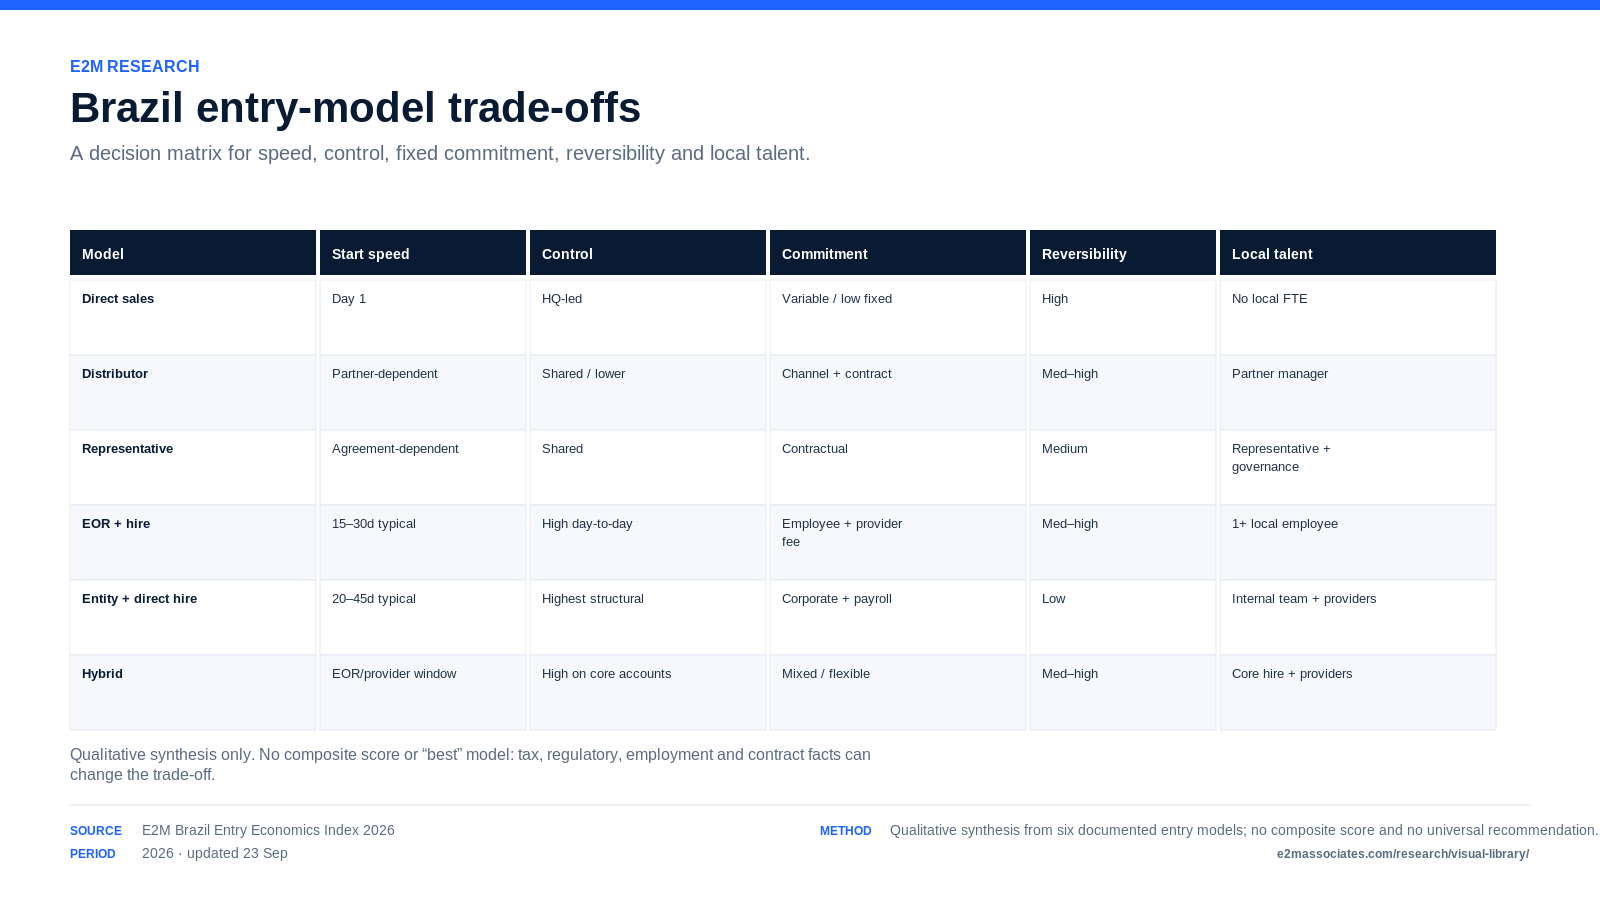
Matrix compares six Brazil entry models across speed, control, commitment, reversibility and local talent needs.
MATRICES

Brazil Entry-Model Trade-Off Matrix 2026

Source: E2M Brazil Entry Economics Index 2026
Period: 2026 · updated 23 Sep
Method: Qualitative synthesis; no composite score or universal best model.

E2M Research. Brazil Entry-Model Trade-Off Matrix 2026. 2026 · updated 23 Sep. /brazil-entry-economics/
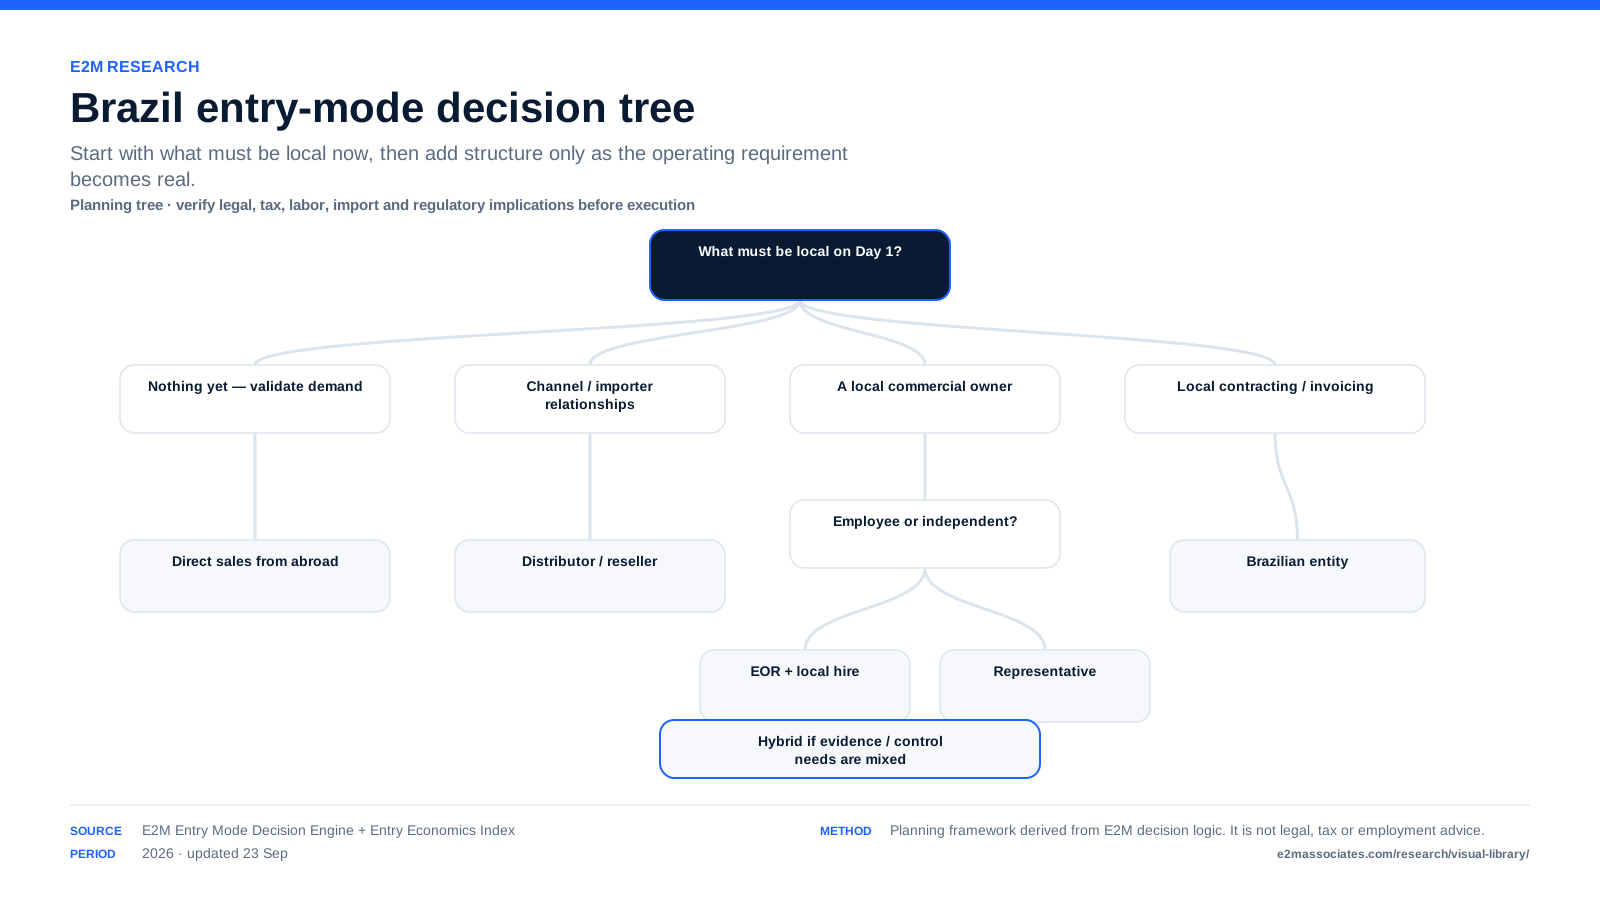
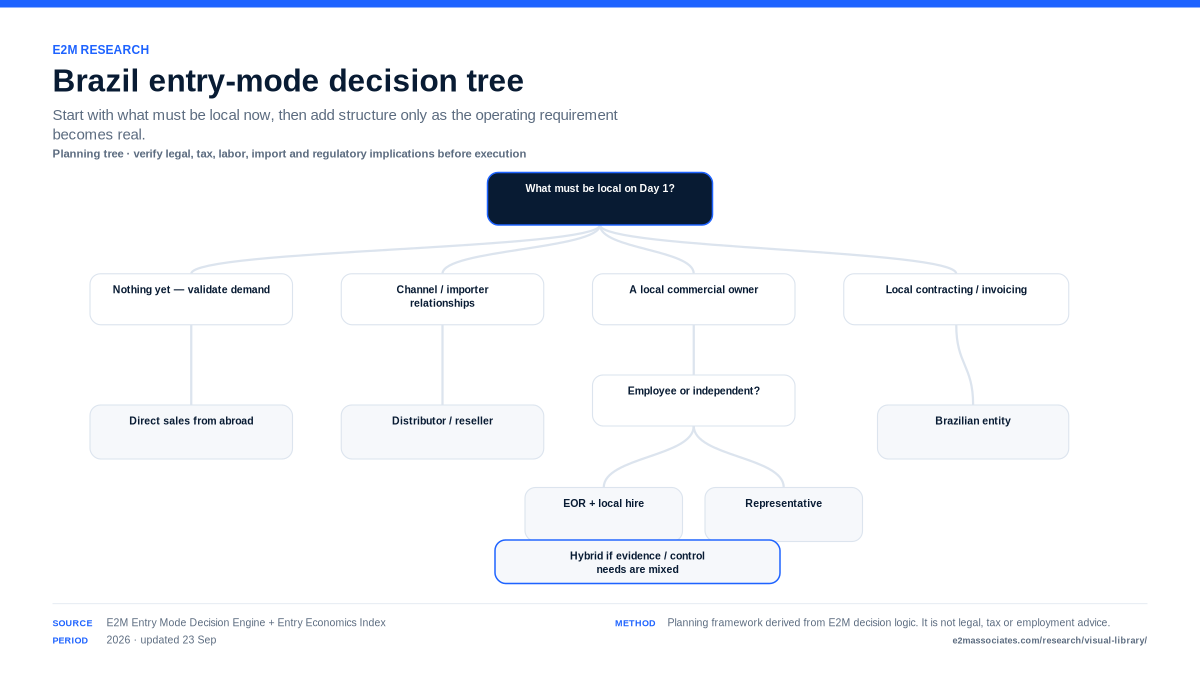
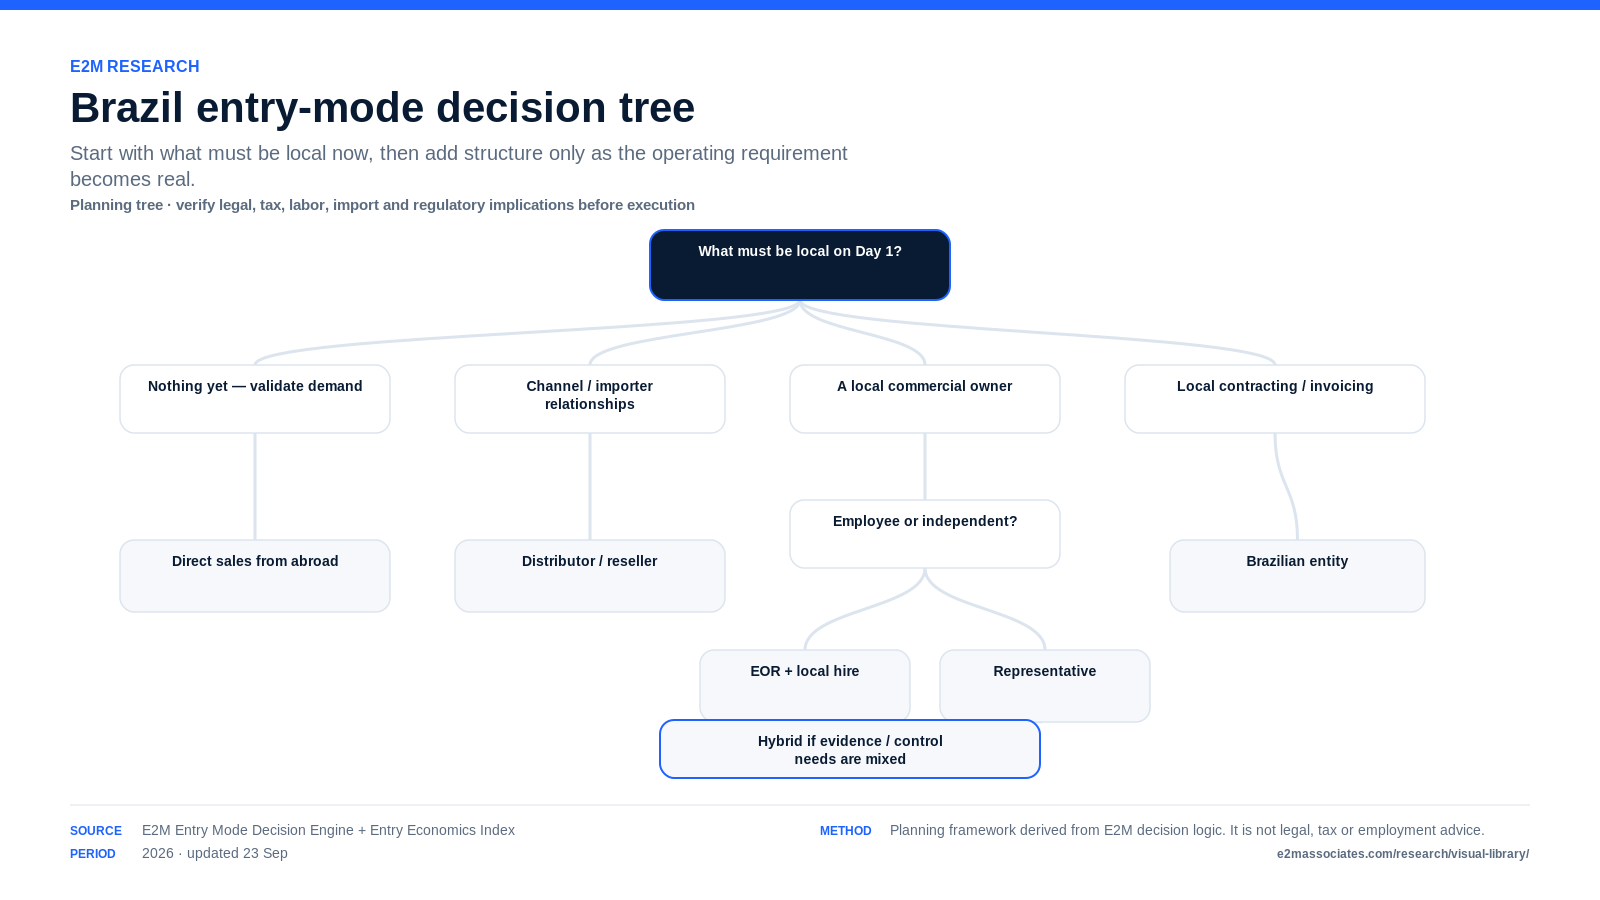
Decision tree routes foreign companies among direct sales, distributor, EOR, local representative, entity and hybrid Brazil entry models.
DECISION TREES

Brazil Entry-Mode Decision Tree 2026

Source: E2M Entry Mode Decision Engine + Entry Economics Index
Period: 2026 · updated 23 Sep
Method: Planning framework; specialist review may be required before execution.

E2M Research. Brazil Entry-Mode Decision Tree 2026. 2026 · updated 23 Sep. /brazil-entry-decision-system/
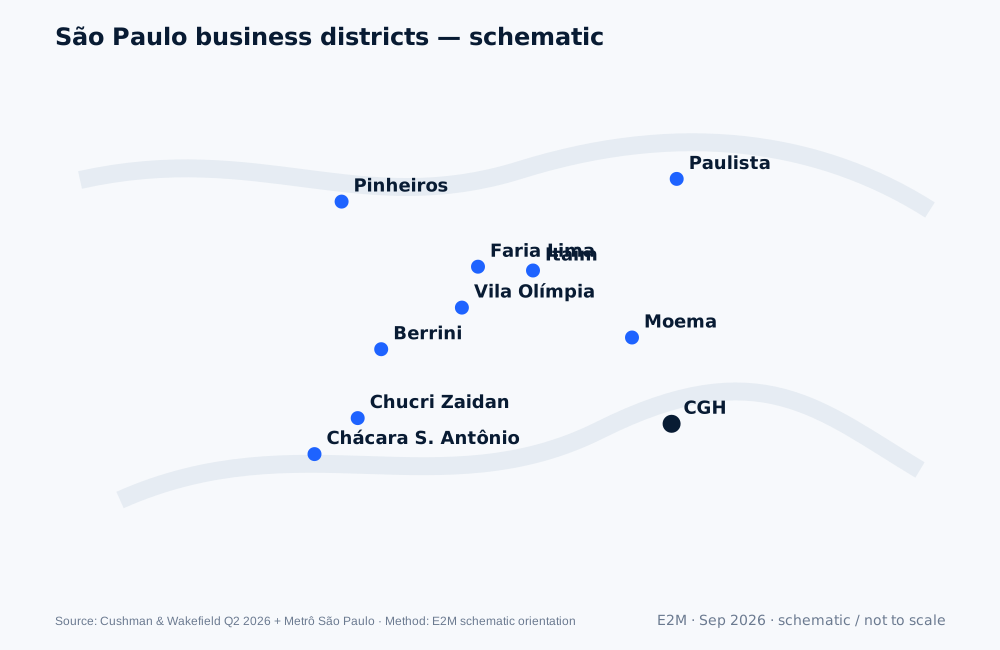
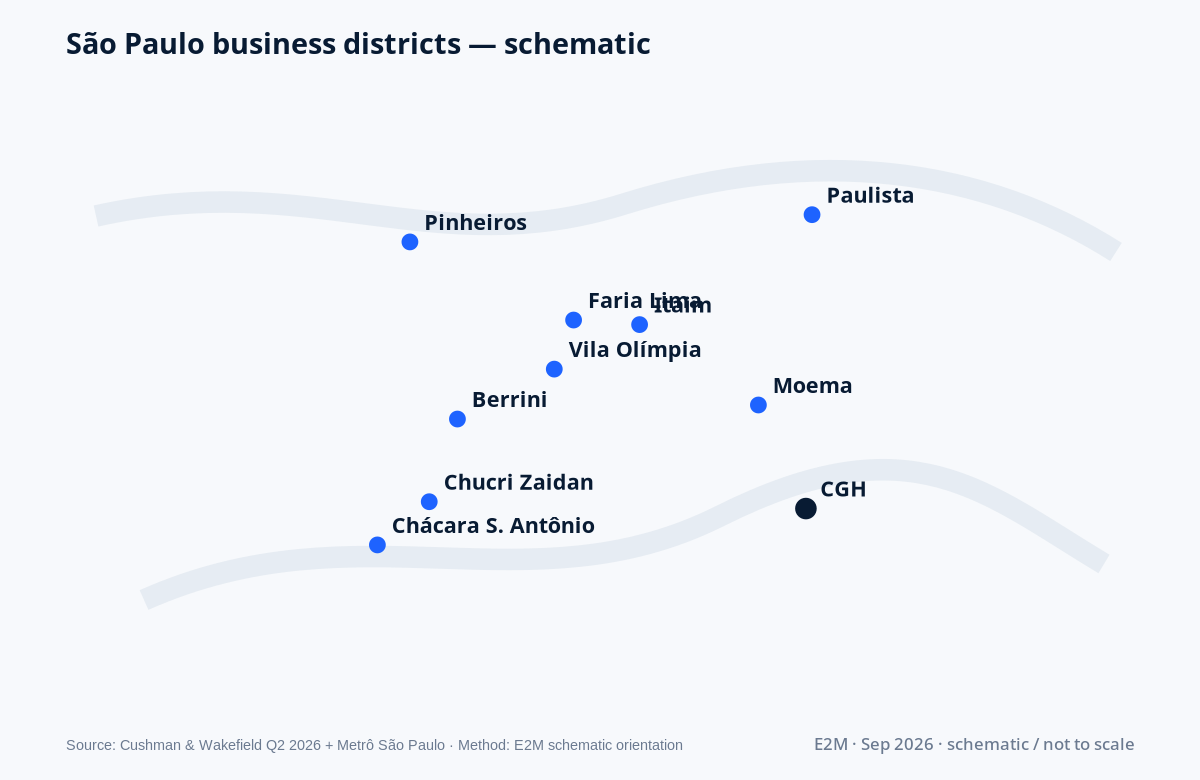
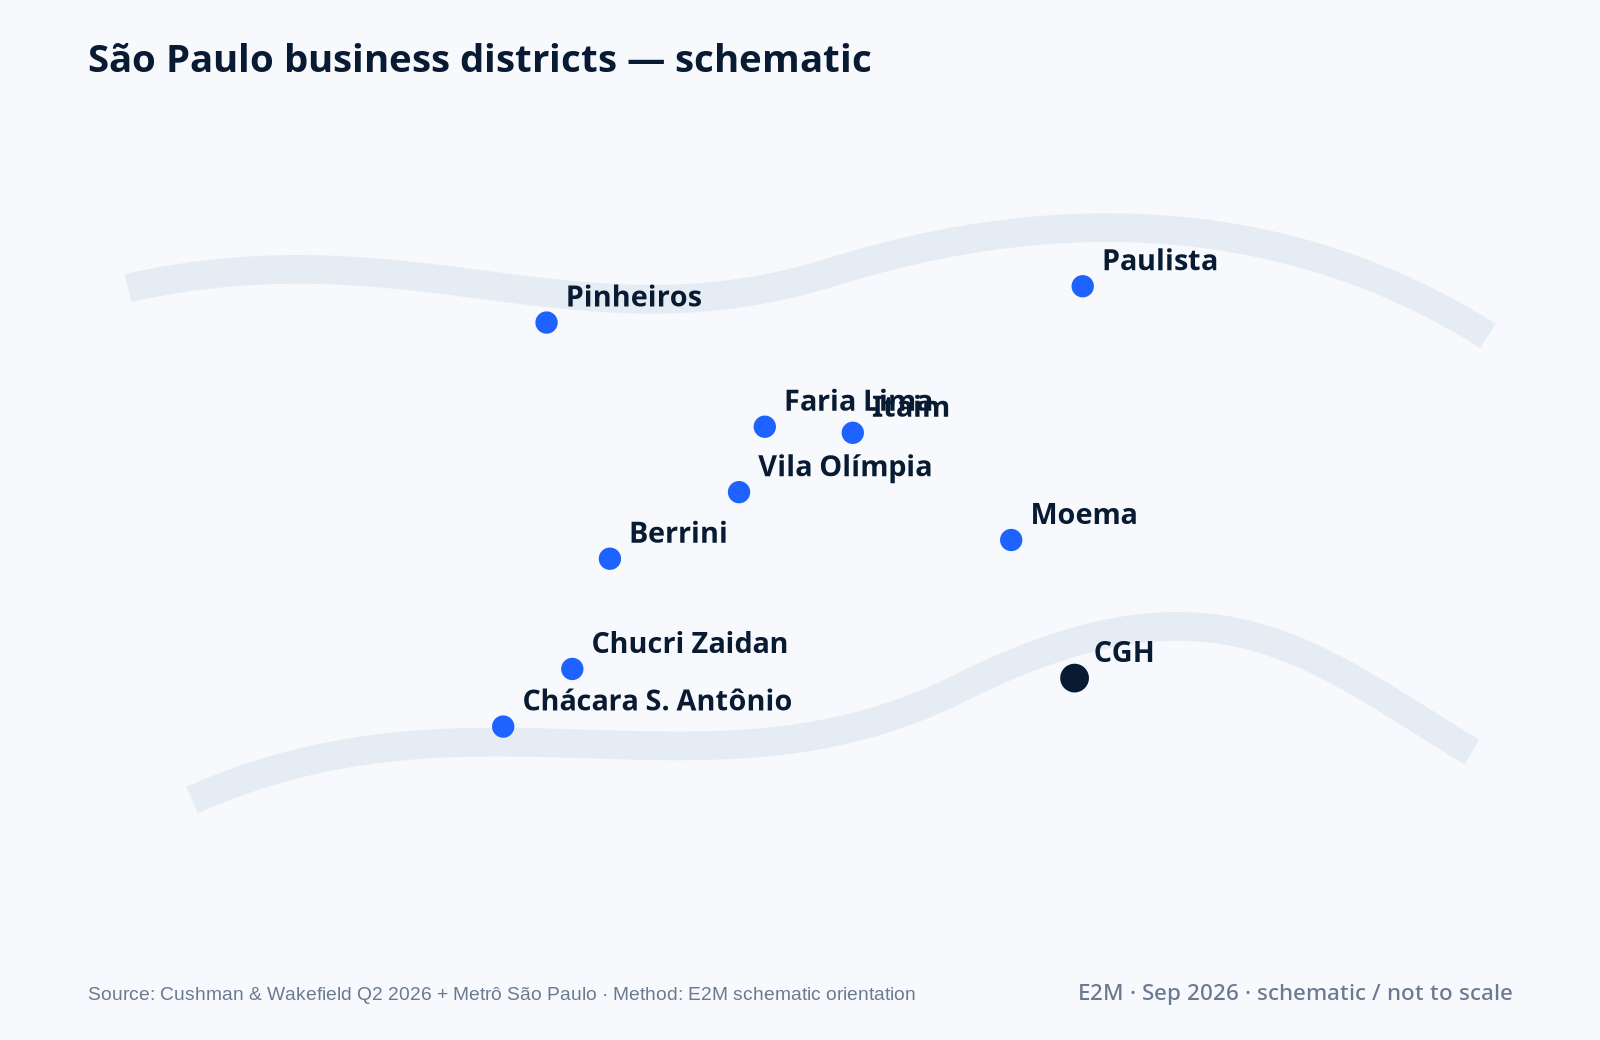
Schematic map locates major São Paulo business districts and Congonhas Airport.
MAPS

São Paulo Business Districts Map

Source: Cushman & Wakefield Q2 2026 + Metrô São Paulo
Period: Sep 2026
Method: Schematic orientation using verified district and transport reference points; not to scale.

E2M Research. São Paulo Business Districts Map. Sep 2026. /research/sao-paulo/business-districts-map/
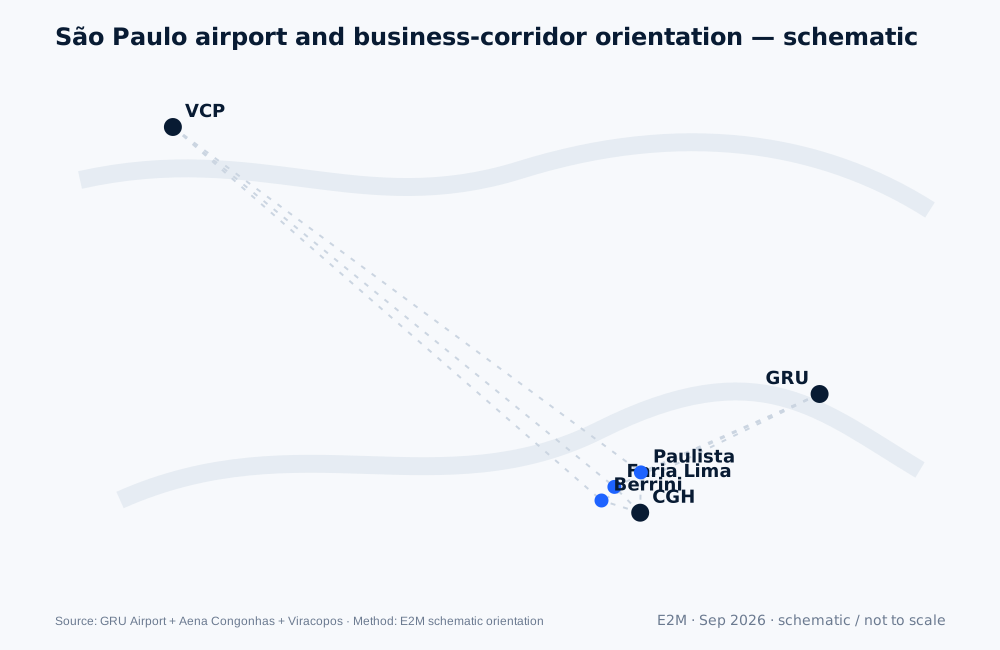
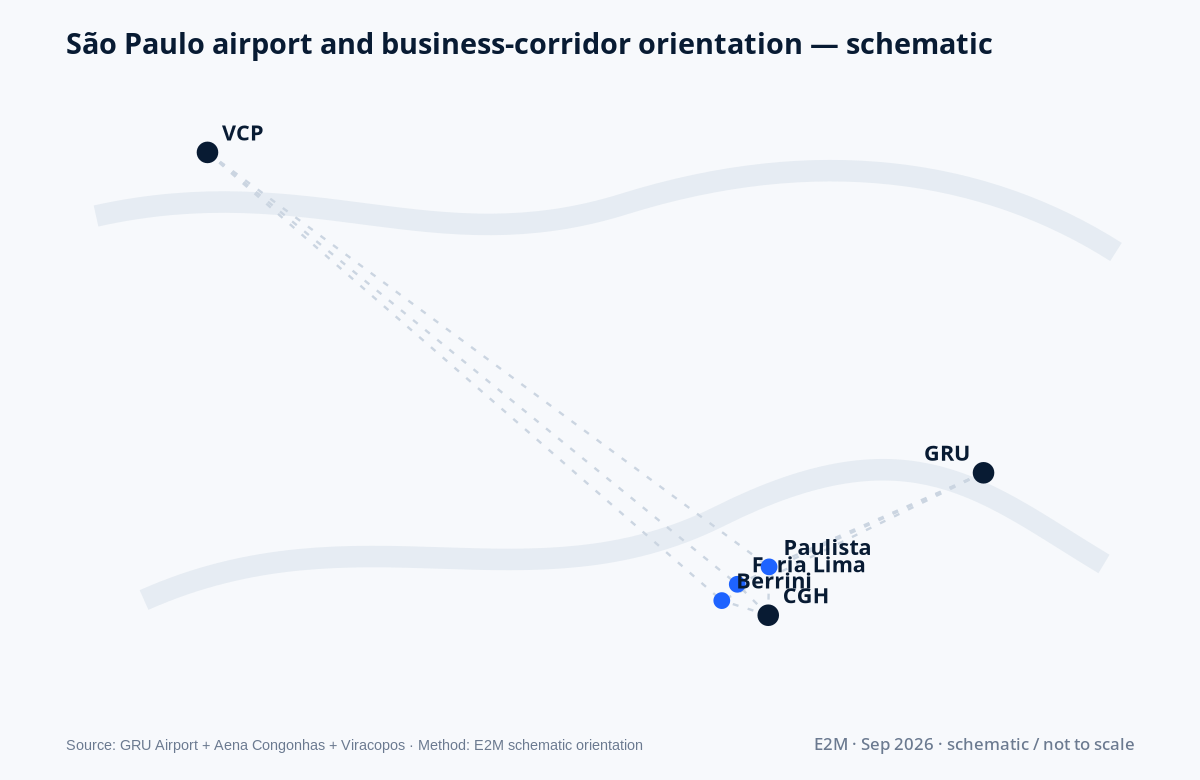
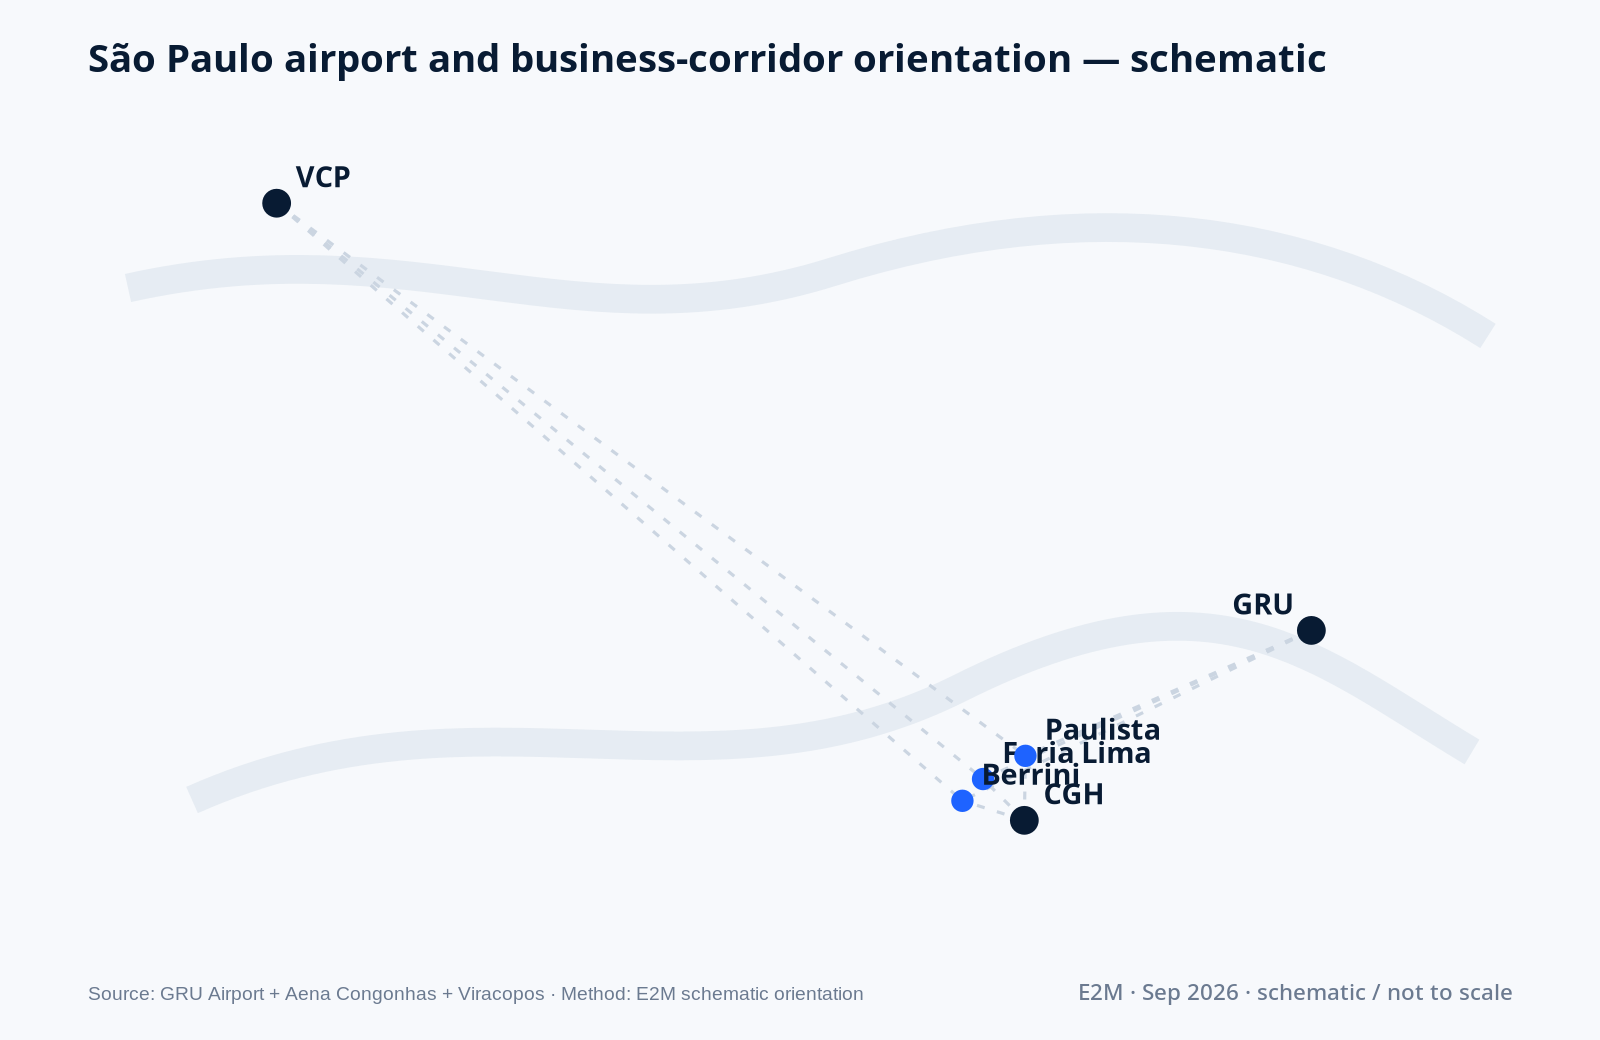
Schematic map locates GRU, CGH and VCP relative to São Paulo business corridors.
MAPS

São Paulo Airport & Business-Corridor Orientation

Source: GRU Airport + Aena Congonhas + Viracopos + E2M geospatial synthesis
Period: Sep 2026
Method: Schematic orientation only; not a routing or travel-time map.

E2M Research. São Paulo Airport & Business-Corridor Orientation. Sep 2026. /research/sao-paulo/airports-gru-cgh-vcp/
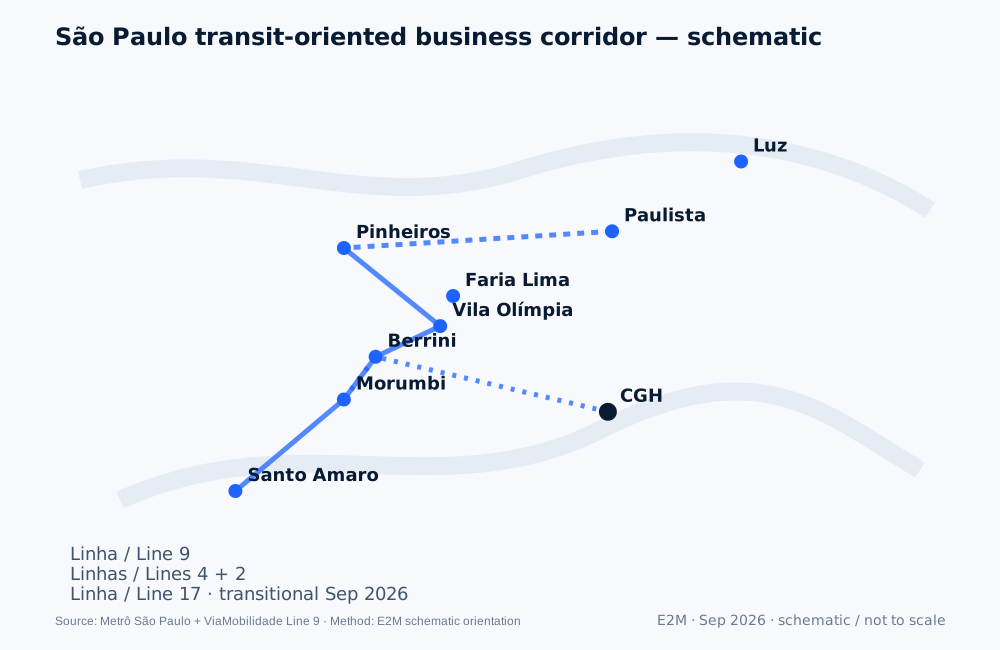
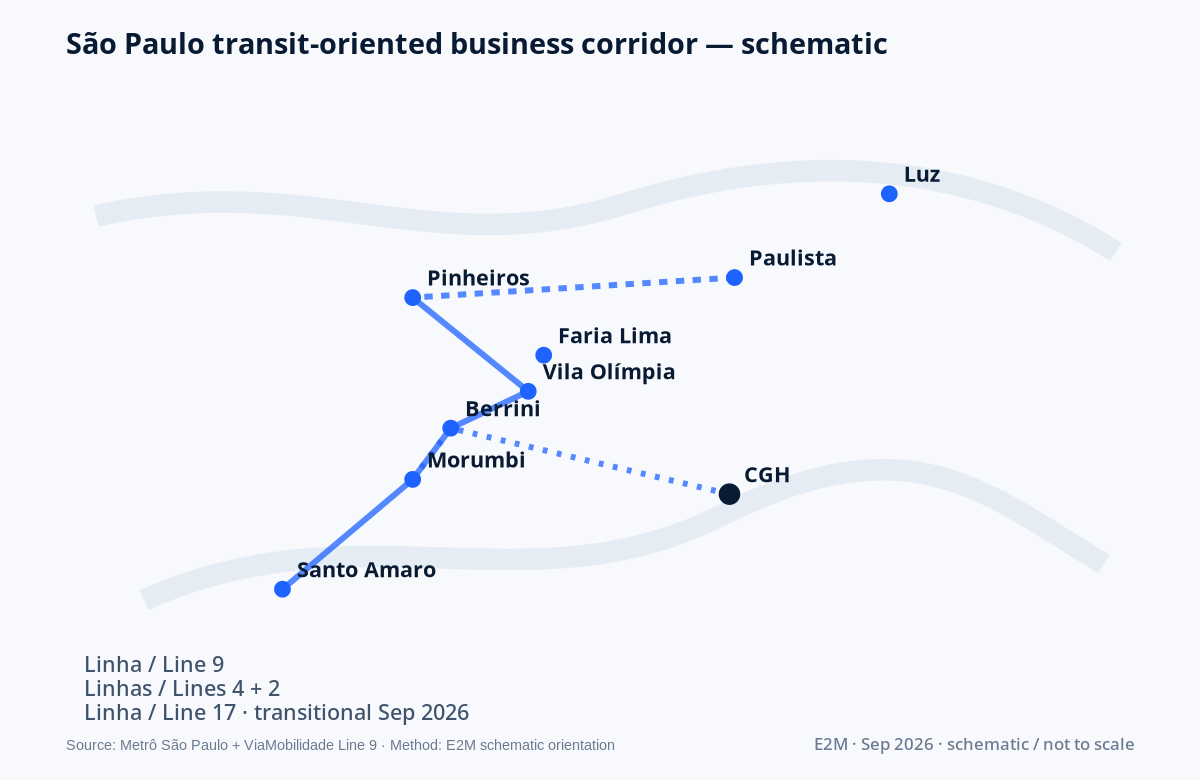
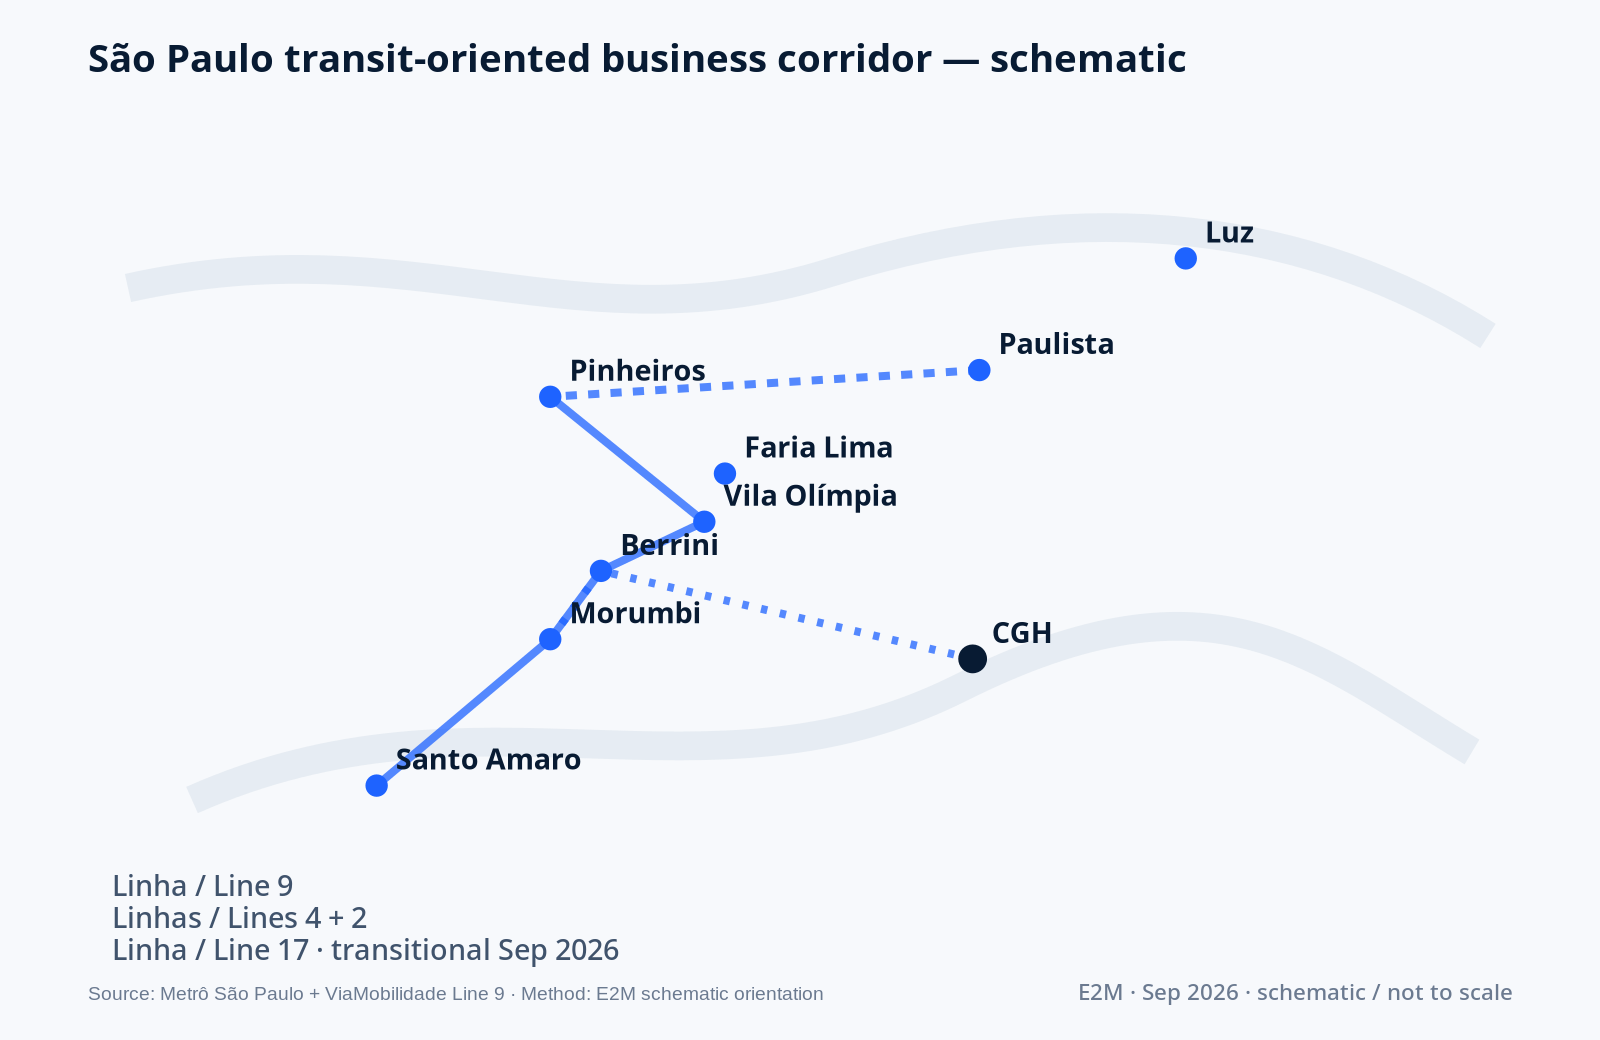
Schematic map shows selected rail and transit corridors serving São Paulo business districts.
MAPS

São Paulo Transit Corridor Orientation

Source: Metrô São Paulo + ViaMobilidade Line 9 + E2M geospatial synthesis
Period: Sep 2026
Method: Schematic orientation of selected business-relevant rail nodes; not a complete network map.

E2M Research. São Paulo Transit Corridor Orientation. Sep 2026. /research/sao-paulo/commute-transit/
Publishing standard

Provenance stays on-imageDo not crop away source, period or method.
One claim per visualEach graphic should answer one decision question.
Evidence boundaries survive reuseModeled, observed and external evidence stay labeled.
Web first, distribution readySVG master plus social and media PNG exports.